Members Home
General Election Preview: Statewide Sweep and Small Gains
Ordinarily, we preview an election with some analyses – hopefully insightful ones – around the storylines we’re following. This time, the storyline seems quite simple: It’s a bad year for Texas Democrats. They’ve been fighting gravity this entire cycle. The only reason it won’t be a worse year for Texas Democrats is redistricting largely replaced competitive seats with safe ones. There’s simply not that much that can be lost or won.
In some key respects, 2022 reminds us of 2010:
- The sitting Republican governor is more popular (or less unpopular) than that Democratic president
- The economy was the top issue for voters, and more than 40% of them think they are economically worse off than a year ago
- The border is the next top issue for voters
- Republicans lead the generic ballot
- Nearly all statewide elected officials were seeking re-election
- Aside from the gubernatorial nominee, the Democratic statewide candidates had very low name ID, insufficient resources and/or had lost previous statewide campaigns
- An unpopular Democratic president was in the White House
- Legislative Republican candidates have big campaign finance advantages, and a handful of big Republican donors dominated the 8-day-out reports; and
- Polls consistently showed the Republican governor holding an upper single-digit lead over the Democratic challenger.
The key difference between 2022 and 2010 is where the election falls in the redistricting cycle. The 2010 election was the last election in that cycle. Over the decade, districts that were drawn Republican-leaning had become more competitive, and a spike in Democratic enthusiasm in 2008 brought them to within a couple of mail pieces from a 75-75 tie in the House. Democrats were thus defending lots of those seats, and they lost pretty much all of them, giving Republicans their first-ever triple-digit membership.
The 2022 election is the first of this redistricting cycle. The new maps locked in Republican majorities in both chambers, and they likewise locked in Democratic blocs. In between are a handful of competitive seats, mostly in South Texas and the suburbs, and those are all that could be won or lost. It cannot be the wipeout that was 2010.
As far as statewide races go, the Republican slate has swept 13 straight elections since the last Democrats were elected in 1994. Every state has elected a Democrat to statewide office since. Even though single-punch, straight-party voting is now a relic, straight-party voting remains extraordinarily high. The margins between the top-performing and lowest-performing candidates continue to narrow. We expect another sweep, and we expect the margins to be 9-12 points across the board, except AG, where a 5- to 7-point margin appears more likely.
The formula for Democratic success requires several disparate elements each to break the right way, as they nearly did in 2018 when then-U.S. Rep. Beto O’Rourke (D-El Paso) nearly upset U.S Sen. Ted Cruz (R):
- Higher turnout among younger voters, infrequent voters and newly registered voters
- Overall turnout more representative of a presidential election than a mid-term one
- A gender gap wide enough, especially in the suburbs, to claw into a huge Republican advantage among men
- Republican-leaning independents willing to split their ticket
- Greater enthusiasm among Democratic voters than Republican ones
- Sufficient support among and turnout from Hispanic/Latino voters
- Strong support and turnout from Black voters; and
- A gap in the rural red wall as Republican voters sense they have no real reason to vote (high likelihood of Republican success at the top coupled with non-competitive local races).
Most of that went O’Rourke’s way in 2018. The biggest exception was the rural red wall – it held. Cruz’s margin of victory came from counties with fewer than 20K voters.
O’Rourke faces a different environment this time. For starters, he’s challenging Gov. Greg Abbott (R), who has consistently been more popular (or less unpopular) than Cruz. O’Rourke also has to carry the burden of his disastrous presidential campaign, which contributed to his higher negative numbers this time around. And then there’s that bulleted list – none of them are as favorable to him as in 2018.
- Early voting turnout is lower among younger voters, infrequent voters and newly registered voters.
- Overall turnout is more representative of a mid-term election than a presidential one.
- The gender gap isn’t as robust as it was four years ago, at least as far as polling goes.
- Republican-leaning independents don’t appear to be as willing to support O’Rourke as they were in 2018, according to the polls.
- Despite the end of Roe v. Wade and the fallout of January 6, Democratic enthusiasm isn’t greater than Republican enthusiasm – This is often the case in mid-term elections. The voters of the party out of the White House are typically more enthusiastic about voting against the president than the president’s party is enthusiastic about voting with him.
- Hispanic/Latino voters, especially along the border, have rapidly shifted toward Republicans, decreasing the Democratic advantage rather than increasing it.
- Black turnout appears to be lower than in 2018, at least in Black-majority precincts and zip codes in some of the bigger counties; and
- That rural red wall has only gotten higher. Abbott’s vote percentage will look like speed limit signs in 200-plus counties.
As the party’s standard-bearer, O’Rourke appears poised to lose to Abbott by around 9 points. For another statewide Democrat to win, they would need the support of roughly one out of every 12 Abbott voters. If we assume straight-party voting is effectively as prevalent as it was in 2018, that equates to about one out of every three people who voted for Abbott and at least one Democrat somewhere on the ballot. That is a tall order.
Looking at districted offices, we project Republicans will gain:
- One seat in the Senate (SD10 open) and narrowly miss gaining a second (SD27 open), giving them a 19-12 majority
- Four seats net in the House – picking up HD37 open, HD52 open, HD65 open, HD70 open and HD74 (Morales) while losing HD92 open – for an 88-62 majority; and
- One net seat in the U.S. House delegation – picking up CD15 open, retaining CD34 (Flores), taking new CD38 and losing new CD37 – for a 26-12 split.
CD28 (Cuellar) is also a potential pickup opportunity, but it requires the district’s electorate to shift quite a bit more, faster than CD15, which was ostensibly drawn as a pickup district. CD34 (Flores) is the only possible Democratic pickup.
In the Texas House, the only other potential Republican pickups are HD34 (Herrero) and, quite a bit longer shot, HD35 (Longoria) and HD41 (Guerra). The only other realistic possibility for a Democratic pickup is HD118 (Lujan). No other Texas Senate seats are realistically in play.
Most of the other storylines will require deeper dives into the data than what can be accomplished in the middle of a Tuesday night. Did Democratic gains in the suburban areas continue, slow or backtrack from 2018 and 2020? Did South Texas’s shift toward Republicans accelerate, stay the same or slow down a bit? Did turnout patterns ultimately look more like 2020 or 2018 (or 2014)? Did the rural red wall get higher (more net votes) or deeper (higher percentage) or both? Did expected lower turnout in blue counties result in lower net votes, lower percentages of the vote, or both? Did absentee ballot rejection rates more closely resemble 2020 or the 2022 primaries? Did Democrats retain the absentee ballot advantage they claimed in 2020, or did the historical partisan balance return?
Our live coverage will begin at 7 p.m. CST. At this point, we expect to sign off around midnight – a few hours earlier than we typically do – because of a relative lack of competitive races to watch. We’ll also be tweeting results and analysis @TXElects.
©2022 Texas Election Source LLC
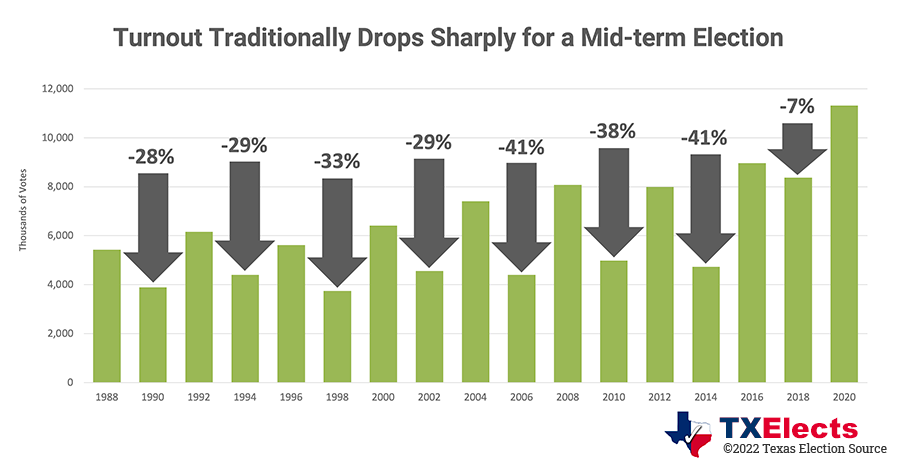
Turnout Appears Headed for the ‘Under’
Tuesday is Election Day.
Early voting ended below the 2018 mark, but daily turnout exceeded the 2018 numbers for the last three days of the early voting period.
Statewide, just under 5.5M Texans voted early in person or by mail through Friday, the end of the early voting period. The final number will rise a bit as mail ballots continue to be accepted. In 2018, the final early voting total was just south of 6M.
In the past three mid-term (gubernatorial) election cycles, about 2.3M Texans have cast ballots on Election Day. If the historical average holds, total turnout will be around 8M, which would fall short of the 8.33M cast in 2018. Our most recent estimate was 8.5M to 9.25M votes cast, so it appears we may be headed for the “under.”
©2022 Texas Election Source LLC
Early Voting Ends on Positive Note
Early voting has ended for Tuesday’s general election.
Turnout continues to be below 2018 levels overall, but it showed signs of gaining ground over the past couple of days. For the first time this year, the number of early voters exceeded the same day in 2018 in the 15 counties with the most registered voters (RVs) on Wednesday and Thursday.
The cumulative number of votes cast in these counties through 10 days is down 13% – about 500K fewer – than in 2018. It is down 32% – roughly 1.5M voters – from 2020. Both of those percentages have decreased over the past couple of days.
Statewide, more than 4.75M Texans have voted in person or by mail through yesterday (Thur.), a turnout so far of 26.9%. As of this point in 2020, 6.9M Texans had already voted, a turnout of 407.5%. Only the 30 counties with the most RVs were required to report daily totals in 2018, so there is no comparable statewide figure.
Looking at the 30 counties with the most RVs, 3.8M votes have been cast so far, a decrease of 13% from the same point in 2018 and 31% from 2020. In the five counties with the most RVs – Harris, Dallas, Tarrant, Bexar and Travis – the number of votes cast is down 16% compared to 2018 and 33% compared to 2020.
In Harris Co., the total number of voters casting ballots early is down 15% from this point in 2018. Turnout is down more in Black- (19%) and Hispanic/Latino-majority (20%) zip codes than in White-majority (5%) zip codes, according to our analysis of turnout data compiled by Harris County Clerk Hector De Leon.
TargetSmart, a Democratic data firm, has been tracking early voting turnout by district. It models partisan affiliation of voters based on their own formulas. According to their modeling, here are the partisan predictions of voters for competitive districts:
- SD27 (Toss Up): 53% Democrat, 31% Republican
- HD34 (Toss Up): 57% Democrat, 30% Republican
- HD35 (Lean D): 68% Democrat, 17% Republican
- HD37 open (Lean R): 48% Democrat, 35% Republican
- HD41 (Lean D): 56% Democrat, 26% Republican
- HD70 open (Toss Up): 46% Democrat, 36% Republican
- HD74 (Lean R): 53% Democrat, 31% Republican
- HD118 (Lean R): 43% Democrat, 38% Republican
- CD15 open (Likely R): 49% Democrat, 36% Republican
- CD28 (Toss Up): 51% Democrat, 31% Republican; and
- CD34 (Toss Up): 61% Democrat, 23% Republican.
The remainder for each district is “unaffiliated” according to their model.
Early voting continues to be dominated by primary voters. According to Republican strategist and data nerd Derek Ryan’s latest analysis, more than 70% of early voters have most recently voted in a Republican primary (42%) or a Democratic primary (29%). General election voters have cast 23% of ballots so far, and voters with no recent history have cast 5% of ballots.
As it has been in recent election cycles, turnout percentages are increase with the frequency of past voting. Ryan looked at the past four primary election cycles and found:
- 81% of people who voted in each of the last four Democratic primaries and 76% who voted in each of the last four Republican primaries have already voted
- 67% of Democrats and 66% of Republicans who voted in three of the past four primaries have already voted
- 55% of Democrats and 56% of Republicans who voted in two of the past four primaries have already voted
- 38% of Democrats and 41% of Republicans who voted in one of the past four primaries have already voted
- 18% of people who have not voted in any of the past four primaries but have voted in at least one of the past four general elections have already voted; and
- 5% of people who are registered to vote but have not voted in any of the past four primary or general elections have already voted.
As we have often said, voting begets voting.
Absentee Ballots: Of the 175K mail ballots that have been processed (not counted) so far, the rejection rate has been 1.78%, according to the Secretary of State. This is above the 2020 general election rejection rate of 1% but well below the 12.4% – one out of every eight – rejection rate for the March primary election. Of the rejected ballots in March, 58% were Democratic primary voters and 42% were Republican primary voters.
House Speaker: Rep. Tony Tinderholt (R-Arlington) filed to challenge Speaker Dade Phelan (R-Beaumont).
Early Voting Turnout May Foretell Trouble for O’Rourke
Early voting concludes Friday for the November 8 general election.
Through yesterday (Tue.), the ninth day of the early voting period, 3.8M Texans have voted early in person (93%) or by mail (7%), corresponding to 21.5% of registered voters (RVs).
As of this point two years ago, an additional 2.1M people had already voted statewide. Compared to the same period in 2020, the total number of voters is down 35%. This percent decline in the number of voters from the immediately preceding presidential election year is more in line with mid-term elections between 1998 and 2014 (36% average decline from preceding presidential election) than 2018 (7% decline). Note: We don’t typically like to compare mid-term election turnout to presidential election turnout, but 2020 is the only other year for which statewide daily data is available.
The number of votes cast in the 30 counties with the most RVs is down 19% from this point in 2018 and 36% from 2020. The number of votes cast in the five counties with the most RVs – Harris, Dallas, Tarrant, Bexar and Travis – is down 22% from 2018 and 38% from 2020. The number of RVs in those five counties has increased by 9% since 2018. Percent turnout in those five counties stands at 20.9%, a decrease of 8.6 percentage points from 2018.
Among the 10 counties with the most RVs, turnout is down most sharply in El Paso Co., home of Democratic gubernatorial nominee Beto O’Rourke. Compared to 2018, the number of votes already cast in El Paso Co. is down 38%. As of yesterday, turnout percentage there was 13.1% of RVs. At the same point in 2018, when O’Rourke was challenging U.S. Sen. Ted Cruz (R), turnout percentage was 23.5%.
Compared to 2018, the number of votes cast in Dallas Co. is down 31%, Harris Co. is down 22% and Travis Co. is down 21%. O’Rourke received 67%, 58% and 75% of the vote in those counties head-to-head against Cruz.
Looking statewide, the counties with the highest turnout percentage so far are Terrell (38.3%), Blanco (34.8%), Llano (34.4%), Jeff Davis (33.9%), Mason (31.1%), Bandera (31.0%), Kendall (30.7%), Loving (30.3%), Washington (30.2%), Foard (30.1%), Schleicher (30.1%), Comal (29.9%), Gillespie (29.9%) and Kerr (29.9%) Cos.
The counties with the lowest turnout percentage so far are Hudspeth (5.9%), Knox (7.7%), Parmer (8.0%), Lynn (8.4%), La Salle (10.1%), Jones (10.4%), Zavala (10.6%), Lamb (11.4%), Ector (11.6%), Crosby (11.7%), Dallam (11.8%), Cochran (12.0%), Winkler (12.2%), Lipscomb (12.4%), Bailey (12.6%) and El Paso (13.1%) Cos. Many of the state’s smaller counties operate a single early voting location, so it is often easier for to vote on Election Day there.
In 2018, nearly 40% of registered voters had cast ballots by the end of the early voting period. To reach that figure this year, 3.5M more Texans would need to vote by Friday. That’s almost the number of Texans who have already voted in nine days plus absentee ballots received prior to the early voting period.
As of this point in 2018, 64% of the early vote had already come in, leaving 36% to come in over the last three days. If those percentages hold for 2022, then around 2.1M votes will come in by Friday, bringing the 12-day total to just south of 7M early voters.
Looking at the 3.8M who have already turned out to vote, three out of four of them have recent primary election voting history, and nearly 500K more of those last voted in Republican primary than in a Democratic primary. Republican strategist and data nerd Derek Ryan’s latest analysis indicates primary voters represent a larger share of the early voting electorate than in 2018.
At this point in 2018, 32% of early voters in the top 15 counties had participated in at least one of the last four Republican primaries and the last primary they voted in was Republican. Democratic primary voters comprised just under 30% of early voters. General election-only voters represented 29% – nearly equal to each party – and “new” voters had cast 10% of votes to date.
According to Ryan, 43% of votes cast so far this year have been by Republican primary voters, 31% by Democratic voters (roughly the same as in 2018), 21% are general election-only voters are 4% are “new” voters, which means they have no history voting in the past four prior election cycles. While not an apples-to-apples comparison, it appears general election-only and “new” voters have been replaced by, or transformed into, Republican primary voters.
Voters under 30 have cast roughly one out of every 14 early votes so far in 2022. They cast roughly one out of every six votes in 2020 and one out of every eight in 2018. According to exit polling data, O’Rourke got 70% support from voters under 30 in his race against Cruz (measured head-to-head).
As we’ve previously opined, these turnout figures are not good for O’Rourke or other Democrats at the macro level. While we expect Election Day voting to rebound from a historically low level in 2020, we do not expect to see an overwhelming crush of O’Rourke voters.
Based on early turnout so far, O’Rourke could need around or just north of two thirds of Election Day voters to break his way, according to our rough back o’ the envelope calculations breaking out voters by age and voting history (Both estimates were within a point of each other.).
In 2018, about a quarter of all voters cast ballots on Election Day. If the 7M early vote figure we floated a few paragraphs above holds, and the 2018 Election Day voting share holds, then about 1.75M Texans would vote on Election Day. This would bring the overall vote total to around 8.75M, within but toward the lower end of our current turnout projection of 8.5M to 9.25M.
©2022 Texas Election Source LLC
Abbott, O’Rourke Empty Wallets As Republicans Dominate Down Ballot
Statewide and legislative candidates facing general election opposition reported raising $47M and spending north of $72M during the monthlong period covered by the latest campaign finance reports. Gov. Greg Abbott (R) and Democratic challenger Beto O’Rourke’s campaigns received 41% of those contributions and made 62% of those expenditures.
The candidates’ 8-day-out reports disclose contributions received and expenditures made between Sept. 30 and Oct. 29. They were due yesterday (Mon.) and became available online today (Tues.). Some remain unavailable, but they will add minimally to the totals reported above. Our Crib Sheets have been updated to show the latest numbers. We have also made our final adjustments to our race ratings, moving 30 races toward the Republicans based in part off these fundraising numbers.
Overall, contributions this period are down 14% compared to the same period in 2020, but the governor’s race and, to a much lesser extent, the LTGOV race skew the comparison. Excluding those two races, contributions are down 57% and expenditures are down 39% from two years ago. One factor is the governor’s race taking a lot of the oxygen out of the room, but the other driving force is a dramatic decrease in competitive House races after redistricting.
In 2020, House Republican candidates raised $27.3M and spent $11.7M during the period covered by their 8-day-out reports. This year, they raised $10.8M and spent $4.2M, representing decreases of 60% and 64%, respectively. House Democratic candidates raised $16.4M and spent $14.1M in 2020. This year, they raised $2.9M and spent $2.5M, declines of 82% from each figure in 2020.
Senate numbers are up slightly from 2020, but all 31 seats are on the ballot this year.
Statewide
GOV (Likely R): O’Rourke out-raised Abbott, $10.5M to $8.8M, and outspent him, $24.4M to $20.8M. Both candidates largely emptied their gas tanks. O’Rourke has $4.25M on hand, edging out Abbott’s $3.77M. It is the smallest cash on hand figure Abbott has reported as an executive branch elected official, barely beneath the $3.78M he reported in July 2005. Candidates were not required to report cash on hand prior to that date.
O’Rourke has out-raised Abbott, $67.6M to $63.9M, for the calendar year, but Abbott has the advantage over the two-year election cycle, $101.5M to $76.6M. Abbott has raised $140.8M since the beginning of 2019, an amount exceeding the total he raised between January 2011 and December 2018 ($135.8M). As governor, Abbott has raised $218.2M, nearly double the amount raised by former Gov. Rick Perry (R) during his gubernatorial tenure (excluding his presidential campaign).
O’Rourke is closing in on the $79M he raised for his 2018 U.S. Senate campaign for the most ever raised by a Democratic candidate in Texas for a statewide race. Abbott’s total for this two-year cycle was already the most in state history. U.S. Sen. Ted Cruz (R) raised more than $90M during a two-year period for his presidential campaign, but that was a nationwide contest and thus we exclude it from statewide campaigns.
This year’s gubernatorial contest is the most expensive in state history. Combined, Abbott and O’Rourke have raised more than $178M during the 2021-22 election cycle, easily surpassing the $113M in combined contributions for the 2018 U.S. Senate race between O’Rourke and Cruz and more than doubling the combined contribution totals from the 2014 gubernatorial race between Abbott and former Sen. Wendy Davis ($88M) and the 2002 race between Perry and Tony Sanchez ($83M).
LTGOV (Lean R > Likely R): Lt. Gov. Dan Patrick (R) out-raised Democratic challenger Mike Collier, $3.3M to $713K, and outspent him, $5.1M to $1.5M. Patrick still has more than $16.5M on hand, suggesting confidence in his polling margin. Collier has $128K on hand.
AG (Lean R): Atty. Gen. Ken Paxton (R) out-raised Democratic challenger Rochelle Garza, $2.4M to $1.1M, and outspent her, $4.9M to $2.3M. Paxton has a 10-to-1 advantage in cash on hand, $2.9M to $285K.
Paxton disclosed a $750K loan from Defend Texas Liberty PAC but did not itemize any contributions. His five-page report includes this memo: “Totals are estimated and will be itemized.” His campaign has repeatedly failed to itemize contributions on reports by their respective due dates, and it appears to be the only campaign at the state or legislative level that experiences such regular difficulty with the filing system.
- He filed a corrected January semiannual report nearly two weeks after the due date to itemize more than $2.1M in contributions
- He filed a corrected 8-day-out report before the primary a day after it was due to itemize $913K in contributions. Three days later, he filed a corrected 8-day-out report to itemize an additional $1.8M in expenditures not previously reported (or included in the totals).
- He filed a corrected July semiannual report itemizing $341K in contributions and $1.3M in expenditures two days after it was due. He initially reported more than $3.6M in unitemized contributions and $5.4M in unitemized expenditures for the period.
Defend Texas Liberty PAC’s report indicates it contributed $300K to Paxton’s campaign during the period covered by the 8-day-out reports. This is in addition to the $750K loan Paxton’s report disclosed.
LAND open (Likely R): Jay Kleberg (D) out-raised Sen. Dawn Buckingham (R-Lakeway), $626K to $581K, and outspent her, $1.4M to $696K. Buckingham has a $501K to $127K advantage in cash on hand.
RRC (Likely R): Democratic challenger Luke Warford out-raised Comm. Wayne Christian (R), $202K to $88K, and outspent him, $309K to $21K. Christian holds a $312K to $206K advantage in cash on hand but appears content to let political affiliation guide his electoral success.
Senate
SD27 open (Lean D > Toss Up): Republican Adam Hinojosa out-raised Democrat Morgan LaMantia, $662K to $136K. He was outspent, $630K to $218K, but $530K of his contributions were in kind. Hinojosa’s largest contributors for the period were Associated Republicans of Texas PAC ($229K), Houston Regional Business Coalition ($200K), Protect and Serve PAC ($51K), Dallas hotelier Monty Bennett ($50K) and Texans for Responsible Government PAC ($50K). LaMantia’s largest contributors were Texas Assoc. of Realtors TREPAC ($42K) and Texas Trial Lawyers Assoc. PAC ($25K). LaMantia added $550K to her loan balance, which stands at just over $5M.
House
HD34 (Lean D > Toss Up): Rep. Abel Herrero (D-Robstown) out-raised Carolyn Vaughn, $124K to $56K, but was narrowly outspent by the challenger, $147K to $142K. She has narrowly outspent the incumbent, $287K to $276K, since July 1.
HD35 (Likely D > Lean D): Rep. Oscar Longoria (D-Mission) out-raised challenger Oscar Rosa, $91K to $60K, but was outspent, $103K to $62K. Longoria has $308K on hand – a high figure for an incumbent in a potentially competitive race.
HD37 open (Toss Up > Lean R): Republican Janie Lopez out-raised Democrat Luis Villarreal Jr., $735K to $57K. Her campaign outspent his, $67K to $54K, and $644K on her contributions were in kind. Lopez’s largest contributors were Associated Republicans of Texas PAC ($304K), Republican State Leadership Committee Grassroots Account ($150K), Texans for Lawsuit Reform PAC ($90K), Texans for Responsible Government PAC ($50K), Protect and Serve Texas PAC ($38K), Texas House Republican Caucus PAC ($20K) and House Speaker Dade Phelan’s campaign ($10K).
HD52 open (Lean R > Likely R): Republican Caroline Harris out-raised Luis Echegaray (D), $601K to $8K, and outspent him, $127K to $7K. She has a $146K to $9K advantage in cash on hand.
HD61 open (Likely R): Republican Frederick Frazier out-raised Sheena King (D), $189K to $24K, and outspent her, $89K to $21K, suggesting recent media stories raising questions about his job performance as a police officer have had no impact on the race.
HD63 open (Lean R > Likely R): Republican Ben Bumgarner out-raised Denise Wooten (D), $218K to $5K, and outspent her, $54K to $3K.
HD70 open (Lean D > Toss Up): Republican Jamee Jolly out-raised Mihaela Plesa (D), $1.4M to $221K. Plesa nominally outspent Jolly, $120K to $80K, but more than $1.2M of Jolly’s contributions were in kind. Jolly’s leading contributors for the period were Texans for Lawsuit Reform PAC ($331K), Associated Republicans of Texas PAC ($325K), Republican State Leadership Committee Grassroots Account ($253K), Speaker Dade Phelan’s campaign ($242K), Texas Assoc. of Realtors TREPAC ($75K), Protect and Serve Texas PAC ($43K), Texans for Responsible Government PAC ($40K) and Texas House Republican Caucus ($20K).
HD74 (Toss Up > Lean R): Republican challenger Katherine Parker out-raised Rep. Eddie Morales Jr. (D-Eagle Pass), $669K to $65K. Morales outspent her, $68K to $33K, but $637K of her contributions were in kind. Parker’s top contributors were Associated Republicans of Texas PAC ($302K), Republican State Leadership Committee Grassroots Account ($235K) and Texans for Lawsuit Reform PAC ($115K).
HD112 (Lean R > Likely R): Rep. Angie Chen Button (R-Garland) out-raised Democratic challenger Elva Curl, $427K to $77K, and outspent her, $452K to $81K.
HD118 (Toss Up > Lean R): Rep. John Lujan (R-San Antonio) out-raised Democratic challenger Frank Ramirez, $1.2M to $239K, and nominally outspent him, $140K to $126K. More than $970K of Lujan’s contributions were in kind.
©2022 Texas Election Source LLC
30 Races Shift Toward Republicans in Our Final Ratings
Our final update to our 2022 race ratings shifts 30 races toward the Republicans and none toward the Democrats.
Based on lagging turnout, especially in areas and among demographics key to Democratic successes in 2018 and on a significant Republican financial advantage to close out the campaign cycle, we have downgraded the Democrats’ expected statewide performance. We have also adjusted the model to throttle back slightly on blue-ward movements in many suburban districts while slightly accelerating red-ward movements in South Texas districts.
In many ways, we are seeing patterns that remind us of 2010. The main difference is, there are far fewer competitive or marginal seats for Democrats to lose this year than in 2010, which was a wipeout election, especially in the Texas House.
As it stands, we now project Republicans to sweep statewide races, gain one seat in the Senate, gain a net four seats in the House and gain a net two seats in the U.S. House delegation.
Statewide Rating Change
- LTGOV (Patrick): Lean R to Likely R
Senate Rating Changes
- SD15 (Whitmire): Safe D to Likely D
- SD17 (Huffman): Likely R to Safe R
- SD18 (Kolkhorst): Likely R to Safe R
- SD19 (Gutierrez): Likely D to Lean D
- SD25 (Campbell): Likely R to Safe R
- SD27 open (LaMantia): Lean D to Toss Up
House Rating Changes
- HD33 (Holland): Likely R to Safe R
- HD34 (Herrero): Lean D to Toss Up
- HD35 (Longoria): Likely D to Lean D
- HD37 open (Lopez): Toss Up to Lean R
- HD41 (Guerra): Likely D to Lean D
- HD42 (Raymond): Safe D to Likely D
- HD52 open (Harris): Lean R to Likely R
- HD54 (Buckley): Lean R to Likely R
- HD63 open (Bumgarner): Lean R to Likely R
- HD70 open (Jolly): Lean D to Toss Up
- HD74 (Morales): Toss Up to Lean R
- HD99 (Geren): Likely R to Safe R
- HD102 (Ramos): Safe D to Likely D
- HD112 (Button): Lean R to Likely R
- HD118 (Lujan): Toss Up to Lean R
- HD121 (Allison): Lean R to Likely R
- HD133 open (DeAyala): Lean R to Likely R
Congress Rating Changes
- CD5 (Gooden): Likely R to Safe R
- CD10 (McCaul): Likely R to Safe R
- CD15 open (De la Cruz-Hernandez): Lean R to Likely R
- CD27 (Cloud): Likely R to Safe R
- CD28 (Cuellar): Lean D to Toss Up
- CD34 (Gonzalez): Lean D to Toss Up
There will be no further updates to our race ratings this cycle.
©2022 Texas Election Source LLC
Lagging Early Voting Pushes Down Our Turnout Estimate
Early voting continues through Fri. for the November 8 general election.
Just south of 3M Texans have voted early in person (92%) or by mail (8%) statewide through yesterday (Sun.), the seventh day of the early voting period. Just over one out of every six registered voters (RVs) has already cast a ballot – down 11 percentage points from the same period two years ago.
Statewide, the number of voters through seven days is down 37% from 2020. We don’t typically like to compare mid-term election turnout to presidential election turnout, but 2020 is the only other year for which statewide daily data is available. What may be more interesting here is the percent decline in the number of voters from the prior election year is more in line with mid-term elections between 1998 and 2014 (36% average decline from preceding presidential election) than 2018 (7% decline).
We previously estimated turnout between 9.5M and 10.25M, corresponding to a 9%-16% drop from 2020. At this point, we are revising our estimated turnout downward to 8.5M to 9.25M voters, which would represent a decrease of 18%-25% from 2020. Even at 8.5M, the number of voters casting ballots would set a mid-term record, eclipsing the 8.37M votes cast in 2018, but turnout as a percentage of RVs would be lower. If 8.5M votes were cast, turnout would be 48% of RVs, down from 53% in 2018.
Looking at the 30 counties with the most RVs, the number of votes cast so far this year (2.36M) is 21% lower than through the first seven days of early voting in 2018 and 38% lower than in 2020. In the five counties with the most RVs – Harris, Dallas, Tarrant, Bexar and Travis – the number of voters so far is 23% below 2018 and 40% below 2020.
Looking at the remaining 224 counties, the number of votes cast is down 33% from 2020 – a smaller percentage decrease than the Top 5 (40%) and the next 25 (36%).
More than three quarters of all early voters to date have cast ballots in at least one of the last four primary elections, according to the latest analysis by Republican strategist and data nerd Derek Ryan. Around 385K more Republican primary voters have already cast ballots than Democratic primary voters. There remain around 460K more Republican primary voters than Democratic primary voters who have not yet voted.
So far, more than 70% of early voters have been aged 50 years or older. More than a third of voters over 70 have already voted, as have roughly a quarter of voters aged 50-69. Voters under 30 have cast 7% of early votes so far, and just 6% of them have already voted.
None of the preceding turnout data should be viewed as favorable for the Democratic slate’s chances statewide.
GOV (Likely R): Gov. Greg Abbott (R) leads Democratic challenger Beto O’Rourke (D), 50%-44%, among likely voters, according to a new Univ. of Texas at Tyler poll.
More than three quarters of likely voters participated in the Republican (42%) or Democratic (35%) primary election this year, and voting blocs that tend to support Abbott more than O’Rourke expressed higher certainty of voting:
- 79% of Republicans said they were “certain” to vote or have already voted compared to 73% of Democrats and 65% of independents
- 83% of respondents over age 45 said they were certain to vote or have already voted compared to 59% of respondents under 45
- 79% of White respondents said they were “certain” to vote or have already voted compared to 69% of Black respondents and 67% of Hispanic/Latino respondents.
Under 10% of voters said they were “not sure” if they would vote (4%), probably would not vote (3%) or definitely would not vote (2%). Early voting numbers to date suggest a much higher percentage will not vote.
The poll of 1,330 registered voters (RVs) – 973 “certain to vote” voters – was conducted by phone and online and was in the field Oct. 17-24. It has a ±3.4% margin of error for the “certain to vote” sample.
LTGOV (Lean R): That UT-Tyler poll finds Lt. Gov. Dan Patrick (R) leading Mike Collier (D), 44%-35%, among likely voters.
AG (Lean R): Atty. Gen. Ken Paxton (R) leads Rochelle Garza (D), 42%-38%, according to the new UT-Tyler poll. Independents broke for Garza, 47%-33%, but are less likely to vote than Republicans (77%-6% for Paxton) or Democrats (78%-6% for Garza).
Libertarian nominee Mark Ash has retracted his op-ed in which he unequivocally endorsed Democratic challenger Rochelle Garza. “Not voting or voting for me may not be enough” to defeat Paxton, he wrote in the now retracted op-ed in the Amarillo Pioneer. “I am recommending Rochelle Garza for Attorney General as the better candidate in this race.” An archived web page of this op-ed remains online.
Campaign Finance: Statewide and legislative candidates facing general election opposition are required to file 8-day-out campaign finance reports today (Mon.). These reports will disclose contributions received and expenditures made between Sept. 30 and Oct. 29. These reports are expected to become available online tomorrow (Tues.), and we will update our Crib Sheets throughout the day.
As of yesterday (Sun.), those candidates must report contributions over and above $1,890 received from a single source through Nov. 7 via daily pre-election reports. Congressional candidates are already within their 24-hour reporting period.
©2022 Texas Election Source LLC
Turnout, Congressional Fundraising Well Below 2020 Levels
Early voting continues for the November 8 general election.
Just over 1.6M Texans have voted early in person (1.4M) or by mail (200K) through yesterday (Wed.), the third day of the early voting period, according to preliminary numbers reported by counties to the Secretary of State. Just over 9.1% of registered voters (RVs) have already cast ballots.
Turnout – both in terms of number of votes cast and percent of RVs – continues to lag behind the last two even-year general elections. Statewide, the total number of votes cast so far in 2022 is down more than 1M (39%) from two years ago. As a percent of RVs, the 9.1% turnout is down from 15.7% through three days of early voting in 2020. Note: We don’t typically like to compare mid-term election turnout to presidential election turnout, but 2020 is the only other year for which statewide daily data is available.
Looking at the 30 counties with the most RVs, just over 1.2M people have voted early so far, a drop of 23% compared to 2018 and 42% compared to 2020. Looking at the five counties with the most RVs – Harris, Dallas, Tarrant, Bexar and Travis – the number of voters so far this year is down 22% compared to 2018 and 42% compared to 2020.
Recent primary voters account for 80% of all early votes cast so far, according to Republican strategist and data nerd Derek Ryan. Republican primary voters, including the small percentage who have also voted in a recent Democratic primary but most recently voted Republican, comprise 47% of early voters so far. Democratic primary voters, including the reverse of the small percentage mentioned above, represent 33% of early voters. Based solely on these percentages at solely this moment in time, statewide Democrats would need the support of roughly 90% of all other early voters to be ahead at this moment.
According to Ryan, 3M Republican primary voters and 2.4M Democratic primary have not yet cast ballots. He defines those voters as having participated in at least one of the last four primary elections. Looking at age groups, 22% of RVs aged 70 and older have already voted compared to just 2% of RVs under age 30.
AG (Lean R): Libertarian nominee Mark Ash endorsed Democratic challenger Rochelle Garza in their race against Atty. Gen. Ken Paxton (R) in an op-ed published by the Amarillo Pioneer.
Campaign Finance: Congressional candidates on the November 8 ballot were required to file their pre-general election reports today (Thur.), assuming they have crossed the reporting thresholds. These reports disclose contributions received and expenditures made October 1-19.
Over the 19-day period, candidates reported raising $4.7M and spending $8.0M. Both figures are significantly lower than the same period in 2020. Excluding the U.S. Senate race, congressional candidates two years ago raised $8.7M and spent $21.6M.
Candidates in just three races accounted for $1.8M (39%) of contributions and $3.7M (46%) of expenditures:
- CD15 (Lean R): Democrat Michelle Vallejo out-raised Monica De la Cruz-Hernandez, $374K to $337K, but the Republican narrowly outspent her, $521K to $516K. De la Cruz-Hernandez has a $589K to $158K advantage in cash on hand.
- CD28 (Lean D): Republican challenger Cassy Garcia out-raised U.S. Rep. Henry Cuellar (D-Laredo), $331K to $94K, but was outspent by the incumbent, $646K to $526K. Cuellar holds a $278K to $189K advantage in cash on hand.
- CD34 (Lean D): S. Rep. Mayra Flores (R-Los Indios) out-raised U.S. Rep. Vicente Gonzalez (D-McAllen), $535K to $176K, and outspent him, $966K to $504K. Gonzalez has a $475K to $364K advantage in cash on hand.
U.S. Rep. Dan Crenshaw (R-Houston) raised $302K, nearly $290K more than his Democratic challenger in a Safe R district. Crenshaw has raised $14.8M during this election cycle, nearly $9M more than any congressional candidate on the general election ballot, but still a bit behind U.S. Sen. Ted Cruz’s (R) $17.3M in contributions. Cruz is up for re-election in 2024. Neither fundraising haul has led to big war chests as Crenshaw has spent $14.4M and Cruz has spent $18.6M during this two-year election cycle.
©2022 Texas Election Source LLC
Early Voting Turnout Lagging Farther Behind Than We First Thought
Early voting continues for the November 8 general election.
Turnout: Early voting counts are preliminary, unofficial and subject to revision, especially during the first couple of days. Well, the Day One numbers have been revised significantly downward.
Yesterday we reported that 789K voters statewide in person or by mail on Monday. The latest data indicates the number was 630K. It appears the cumulative number of returned mail ballots was added twice to the number of in person voters for each county.
This means that Day One turnout has decreased from 2020 and 2018 even more than we reported yesterday. Rather than revisit those figures here, we’ll move on to Day Two’s (Tues.) counts.
Statewide, 1.13M people have cast ballots in person (952K) or by mail (177K). Through Day Two in 2020, 1.9M people had voted in person (1.49M) or by mail (417K). So the statewide figures are down 41% overall with in person voters down 36% and absentee voters down 58%. Statewide, 6.32% of registered voters have already cast ballots, compared to 11.22% through Day Two of 2020. The better comparison might be to 2018, but only the 30 counties with the most RVs were required to report daily figures that year.
Looking at those Top 30* counties, 875K people have voted early through Day 2, down 25% from 2018 and 42% from 2020. In the five most populous counties – Harris, Dallas, Tarrant, Bexar and Travis – a total of 429K people have voted already, down 28% from 2018 and 46% from 2020.
Voter Registration Litigation: The federal Fifth Circuit Court of Appeals upheld new voter registration requirements, overturning a lower court decision setting aside the law for creating an unconstitutional burden on the right to register to vote. The three-judge panel ruled the plaintiffs, LULAC and Voto Latino, lacked standing because they had not been harmed by the law.
©2022 Texas Election Source LLC
Day 1 Early Voting Totals Lag Behind 2018, 2020
Early voting continues for the November 8 general election. Just under 4.5% of registered voters have cast ballots in person or by mail through yesterday (Mon.), the first day of early voting by personal appearance.
A total of 789K voters have already cast ballots statewide based on preliminary, unofficial counts provided by counties to the Secretary of State. Several counties have not reported, and others have not reported mail ballots, so we expect the number to be revised upward, but probably not by a large amount. The first-day total for 2020 was 1.13M. Comparable figures are not available for 2018 because only the 30 counties with the most RVs were required to provide daily updates that year.
As it currently stands, the Day 1 total number of voters for those 30 counties is down 13% from the first day of early voting in 2018 and 32% from 2020. In the five counties with the most RVs – Harris, Dallas, Tarrant, Bexar and Travis – the total number of voters is down 17% from 2018 and 38% from 2020. Harris Co. itself is down 40% – almost entirely due to a 52% decrease in the number of in-person voters.
Roughly five out of every six early voters have recent primary voting history, according to a preliminary analysis of voter history by Republican strategist and data nerd Derek Ryan:
- 46% voted in at least one of the last four Republican primaries, but no Democratic ones
- 31% voted in at least one of the last four Democratic primaries, but no Republican ones; and
- 5% voted in at least one of each party’s last four primaries.
About 14% voted in at least one of the last four general elections but no primaries, and just 3% have no recent voting history. These latter two blocs of voters tend to become more prominent as we get closer to Election Day.
©2022 Texas Election Source LLC
