Texas Election Source has updated 27 race ratings based on the latest polling, July campaign finance reports and primary runoff results. Twenty of those races moved one column toward the Democrats’ advantage. Our complete ratings are located here. Thirteen Republican-held seats in the legislature or congressional delegation are rated Toss-up or Lean Democratic. No Democrat-held seat is rated below Lean Democratic after several seats formerly in the Toss-up column were shifted into the Lean Democratic column.
The most significant impact of the new ratings on our projections is in the Texas House. Democrats need a net of nine seats to retake a majority in the chamber. We project they will get six, up three from our April ratings, which would cut the Republicans’ advantage to 77-73 entering the 2021 legislative session. Seven more Republican-held seats are projected to be within 1.5 percentage points of the range we consider a toss-up race. Only two Democrat-held seats are projected to be within 1.5 percentage points of a toss-up.
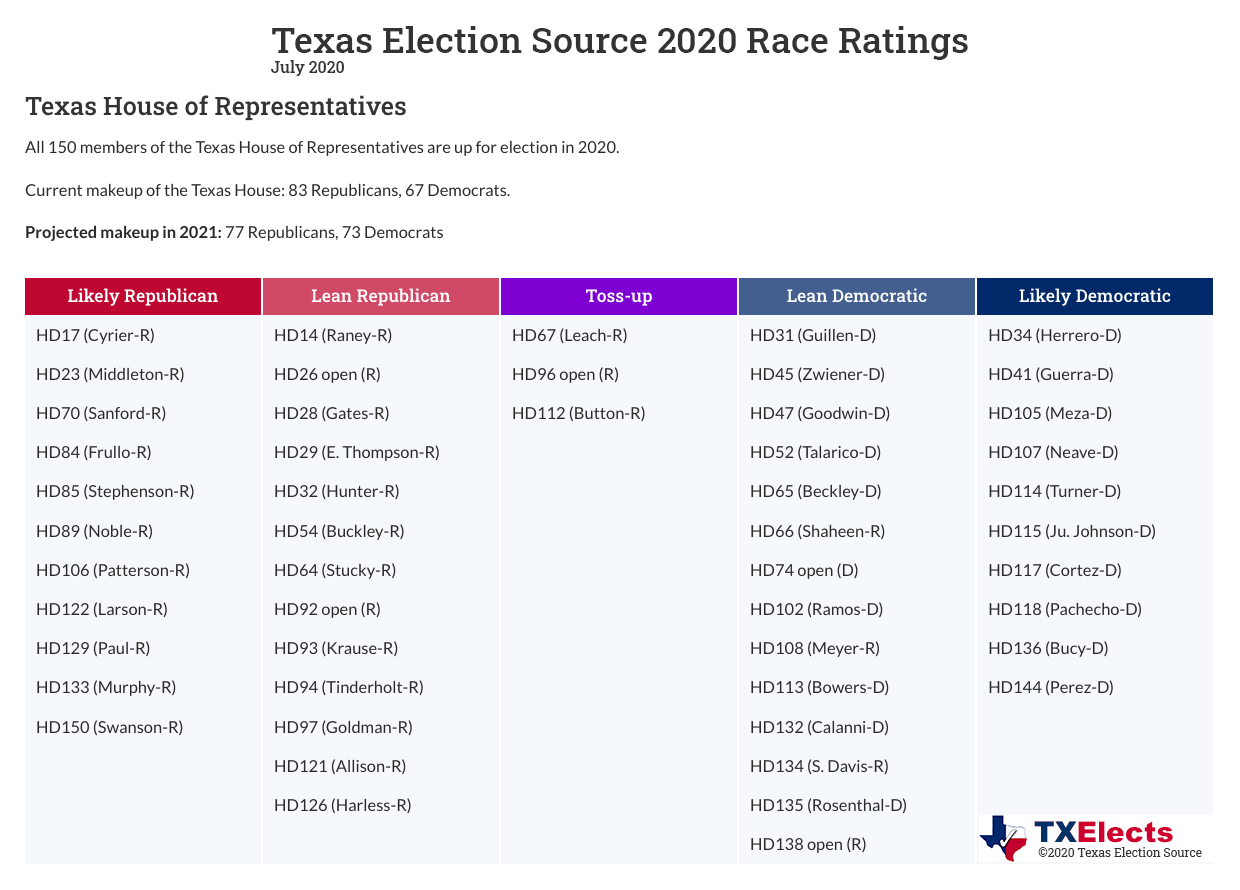
Four Republican-held seats are rated Lean Democratic, listed from greatest to least lean:
- HD134 – Rep. Sarah Davis (R-Houston) vs. Ann Johnson (D)
- HD138 open – Lacey Hull (R) vs. Akilah Bacy (D)
- HD108 – Rep. Morgan Meyer (R-Dallas) vs. Joanna Cattanach (D); and
- HD66 – Rep. Matt Shaheen (R-Plano) vs. Sharon Hirsch (D).
Since 2010, the four House seats on the list have drifted an average of 7.3 percentage points bluer, relative to the state as a whole. Two seats in other chambers – CD23 and SD19 – are also rated Lean Democratic. They have gotten relatively redder but remained 3.9 and 9.1 percentage points bluer than the state as a whole in 2018. We are projecting SD19 to get another 1.4 percentage points redder, but even that keeps it just .07% from being labeled as Likely Democratic.
Incidentally, HD134 would rate as Likely Democratic but for Davis’s consistent over-performance of other Republicans in the district. In 2018, the average Democrat received 55% of the vote in her district measured head-to-head against the Republican, but Davis survived thanks to ticket-splitting voters. Longtime political observers will remember former Rep. Jim McReynolds (D-Lufkin) who held onto his district by finishing as much as 19 points better than the rest of the Democratic slate. He was overwhelmed by rising Republican leanings in 2010 but still over-performed the rest of the ticket by 12 points. We project Davis’s ability to win over ticket-splitting voters will not be enough this year.
Dallas Co. was the epicenter of the Democratic surge in 2018. Only two Republicans represent the county in the state House currently, and we project that number will be zero after November. Tarrant Co., home to five races rated Toss-up or Lean Republican, and Fort Bend Co., with three seats in the Lean and Likely Republican columns, are expected to be the chief battleground counties in the House this year.
Moving on to the Senate, the Republican-held seat in either chamber or Congress deepest into the Lean Democratic column is SD19, which was won by Sen. Pete Flores (R-Pleasanton) in a 2018 special runoff election over former U.S. Rep. Pete Gallego (D-Alpine). He faces Rep. Roland Gutierrez (D-San Antonio) in this year’s general election. In 2018, the district’s precincts were 9.1 percentage points bluer than the state as a whole, and the average statewide Republican candidate received 45% of the vote there measured head-to-head against the Democratic candidates.
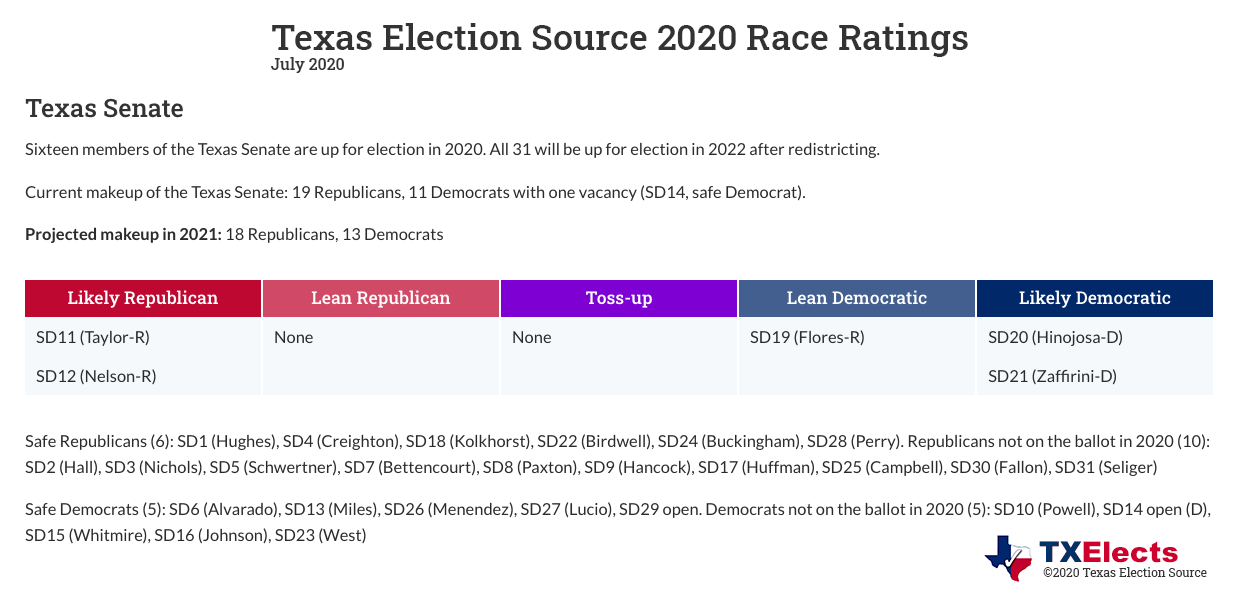
SD19 is the only Senate district that has any real chance of being flipped. Republicans are not having to defend the next seven likeliest seats to flip after Flores’s, leaving only Sens. Jane Nelson (R-Flower Mound) and Larry Taylor (R-Friendswood) as the next most likely. Their districts were 6.1 and 6.5 points redder than the state as a whole in 2018.
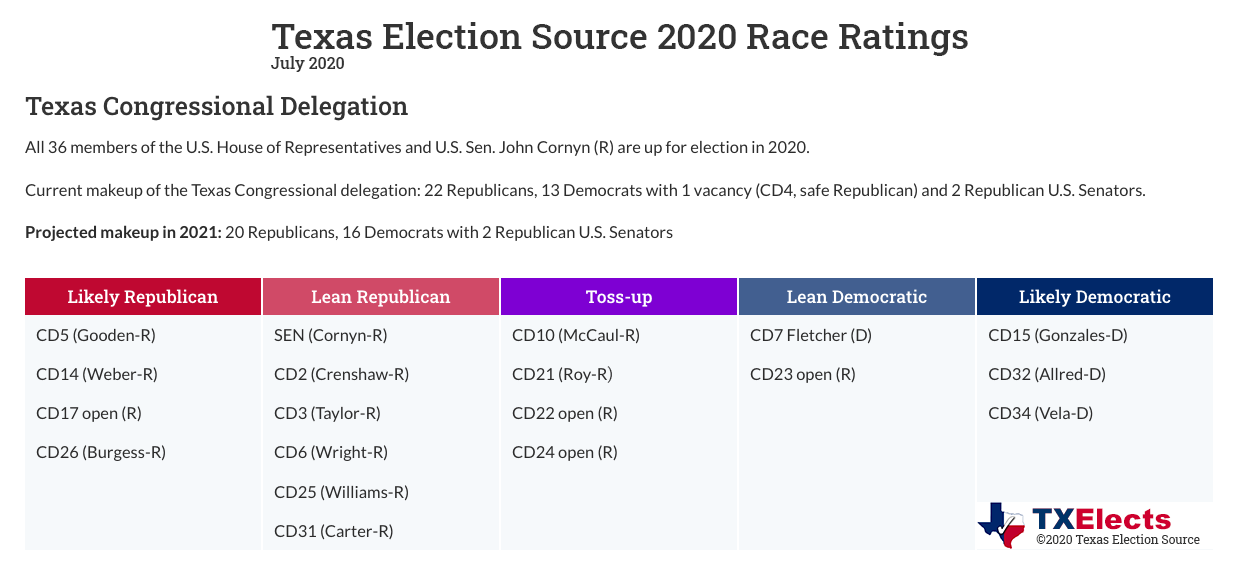
We project Democrats will pick up three seats in Congress, up from two in our previous ratings. Four additional Republican-held seats are within 1.25 percentage points of being included within the Toss-up column.
We rate seats based on a seven-point scale from Safe Republican to Safe Democrat based on our projections of how much redder or bluer a district is going to be than the state as a whole. This process begins with an estimate of the presidential race and how much different that race will be from the other statewide races. Based on trends in polling data – not just on the horse race itself – we project President Trump will carry Texas by 2.5 percentage points over presumptive Democratic nominee Joe Biden. We project Biden will finish 1.75 percentage points ahead of the remaining statewide Democratic candidates.
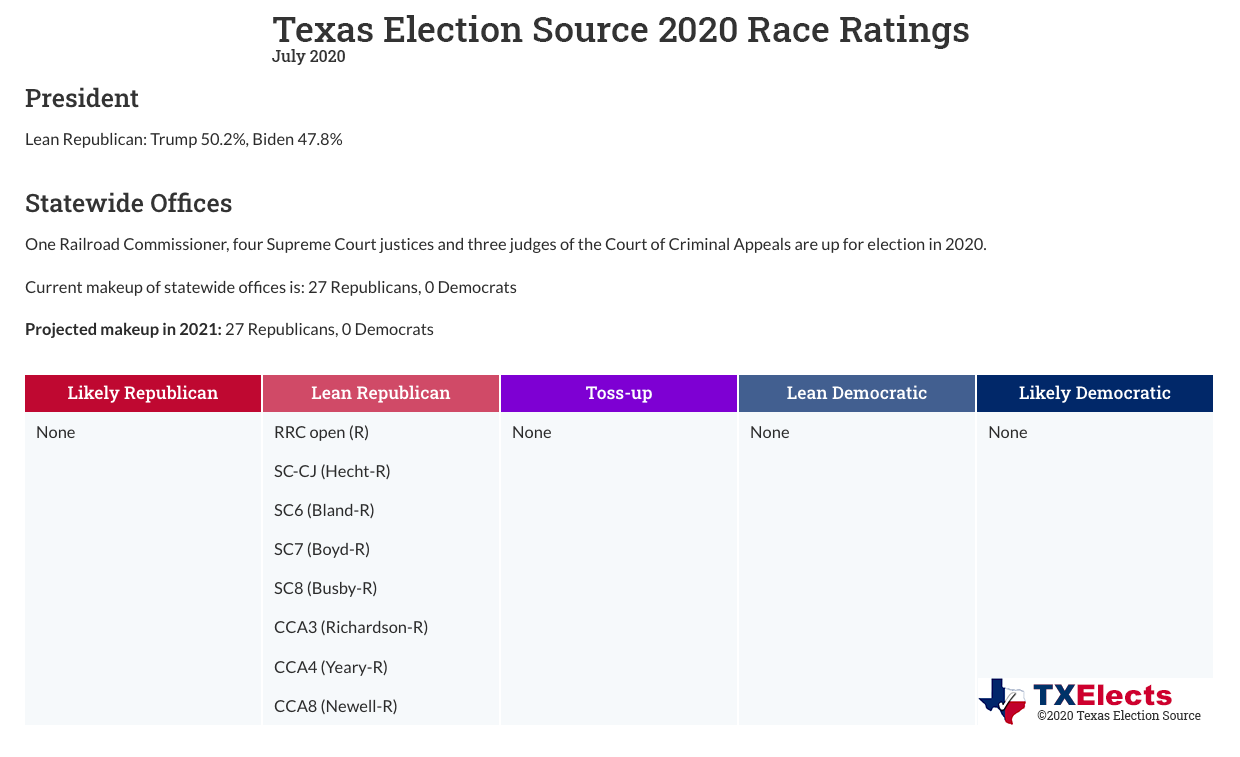
That produces a statewide Democratic average performance of 47.2%, measured head-to-head against the average Republican performance. We could just as easily calculate these percentages from the Republican perspective, in which case the average statewide Republican is projected to receive 52.8% of the vote head-to-head against the Democrats.
We then “float” the districts above or below that percentage based on past history, recent trends, the incumbent’s tendency to over- or under-perform their party’s candidates and campaign finance advantages. Our election data for each district goes back to 2002.
Calculating partisan leans in this manner accounts for often large variability between presidential and gubernatorial election cycles and enables a more stable long-term trend to emerge. Districts typically do not vary by more than 2.4 percentage points relative to the state from general election to general election, regardless of what the average Democratic candidate actually received in the district when looking at any election year in a vacuum.
Our projections continue those trends, albeit at slower rates than have been observed in recent election cycles because of larger than average jumps seen from 2016 to 2018.
We will re-run our model based on latest polling data just after Labor Day and again after candidates’ next campaign finance reports are filed.
Summary of Ratings Changes
Statewide (Projected 27 R, 0 D)
- RRC open – Lean Republican from Likely Republican
- Supreme Court (4 races) – Lean Republican from Likely Republican
- of Crim. Appeals (3 races) – Lean Republican from Likely Republican
Senate (Projected 18 R, 13 D)
- No changes
House of Representatives (Projected 77 R, 73 D)
- HD31 (Guillen) – Lean Democratic from Likely Democratic
- HD38 (Lucio III) – Likely Democratic from Safe Democratic
- HD54 (Buckley) – Lean Republican from Toss-up
- HD65 (Beckley) – Lean Democratic from Toss-up
- HD66 (Shaheen) – Lean Democratic from Toss-up
- HD74 open – Lean Democratic from Likely Democratic
- HD102 (Ramos) – Lean Democratic from Likely Democratic
- HD108 (Meyer) – Lean Democratic from Toss-up
- HD114 (Turner) – Likely Democratic from Lean Democratic
- HD132 (Calanni) – Lean Democratic from Toss-up
- HD134 (S. Davis) – Lean Democratic from Toss-up
- HD135 (Rosenthal) – Lean Democratic from Toss-up
- HD138 open – Lean Democratic from Toss-up
- HD144 (Perez) – Likely Democratic from Safe Democratic
Congress (Projected. 20 R, 16 D | 2 R, 0 D)
- CD7 (Fletcher) – Lean Democratic from Toss-up
- CD12 (Granger) – Safe Republican from Likely Republican
- CD21 (Roy) – Toss-up from Lean Republican
- CD28 (Cuellar) – Safe Democratic from Likely Democratic
- CD32 (Allred) – Likely Democratic from Lean Democratic
©2020 Texas Election Source LLC
