Joe Biden beat President Trump by a little over 850K votes in the seven counties with at least 500K registered voters. That’s nearly double the 443K-vote margin Hillary Clinton had in those counties four years earlier and a little over 100K above Beto O’Rourke’s margin over U.S. Sen. Ted Cruz (R) in 2018.
Trump beat Biden by a little over 850K votes in the 207 counties with fewer than 50K registered voters. The state’s seven largest counties were completely offset by its 207 “smallest” counties. The good news for Democrats running statewide is those “small” counties used to more than offset the bigger ones. In 2008, Barack Obama beat John McCain by 70K votes in the seven big counties and lost to him by more than 500K votes in the “smaller” ones. And it wasn’t that long ago that Republicans were winning the biggest ones, too (Obama lost the big counties by 41K votes in 2012).
The bad news for Democrats running for statewide office, say in 2022, is that this rural red wall is very strong, indeed. The other bad news for Democrats is, the 40 counties in the middle – 50K-250K registered voters – favored Trump by 650K votes, which was the President’s statewide margin of victory.
The other, other bad news for Democrats is, the Republican advantage in the “smaller” counties is still growing. Trump increased his 2016 margin by roughly 170K net votes and about 330K more than Cruz’s margin two years ago.
The other, other, other bad news for future statewide Democratic candidates is, where some of that growth came from.
Building a Political Wall
In 2016, candidate Trump received 29% of the vote, measured head-to-head against Clinton, from counties where Hispanics/Latinos comprise at least 75% of the population. That was the worst performance for any Republican presidential or gubernatorial candidate in those counties since at least 1990. That said, it wasn’t the worst by much. Bob Dole received 31% of the vote in these counties in 1996, as did Mitt Romney in 2012. John McCain fared only a point better in 2008.
Trump received 39% of the vote in those counties in 2020, a 10-percentage point improvement. Trump’s share eclipsed Gov. Greg Abbott’s (R) 37% in his 2014 and 2018 races, and it was just behind George W. Bush’s 40% share in 2000 (Bush got 45% in 2004).
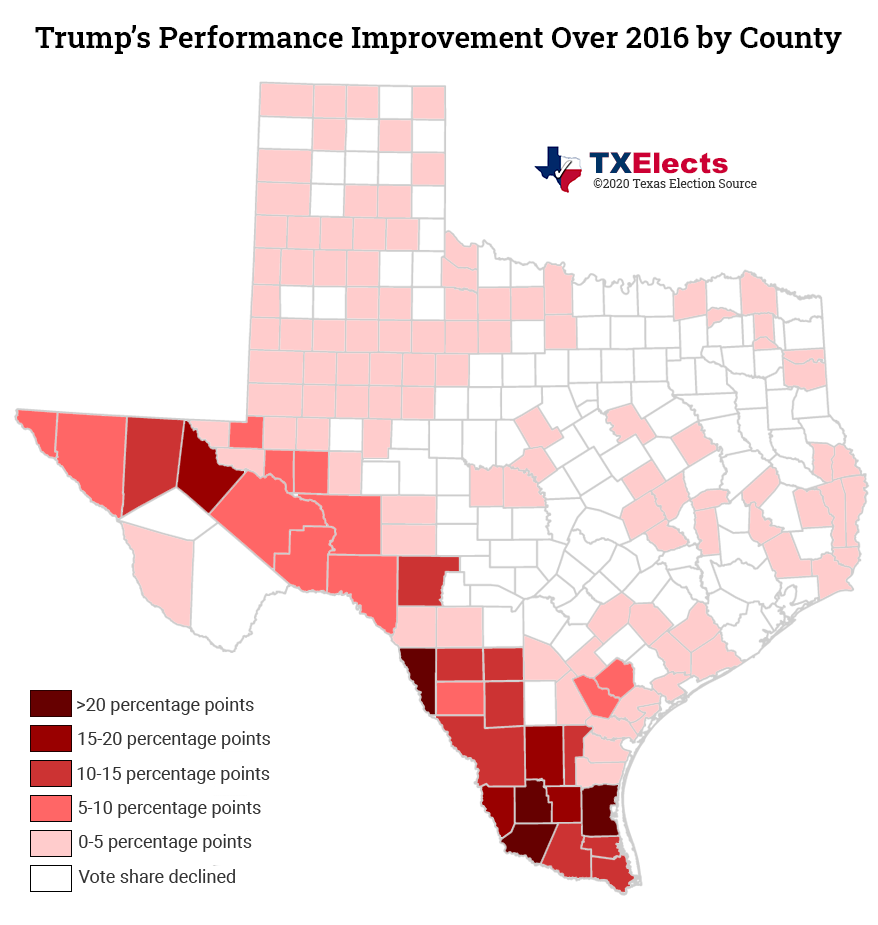
Trump’s biggest performance increases over 2016 occurred in Starr (+28.2%), Maverick (+23.9%), Kenedy (+20.3%), Jim Hogg (+20.2%), Zapata (+19.5%), Duval (+16.6%), Brooks (+16.4%) and Reeves (+15.7%) Cos. Trump did not win any of these counties in 2016. He won Kenedy (66.2%), Reeves (61.7%) and Zapata (52.8%) Cos. and nearly won Duval (48.7%), Starr (47.5%) and Maverick (45.3%) Cos.
He may well be the first Republican to carry Zapata Co. We looked back as far as we could find records and did not see another one, though we did find some years where no official results were reported. Trump gained more than 1K votes over his 2016 total there, while Biden’s total declined by about 250 from Clinton’s 2016 total.
In fact, nearly 10K more voters cast ballots for the Democratic and Republican presidential candidates in these eight counties than in 2016. Trump increased his vote total by 14K, while Biden’s total was 4K fewer than Clinton. It’s equivalent to Trump flipping 4K voters from 2016 and adding 100% of the new ones.
Oil & Gas Roots
It would be a mistake to ascribe this remarkable shift to any one cause, but there appears to be something highly correlated to Trump’s gains: the oil and gas industry.
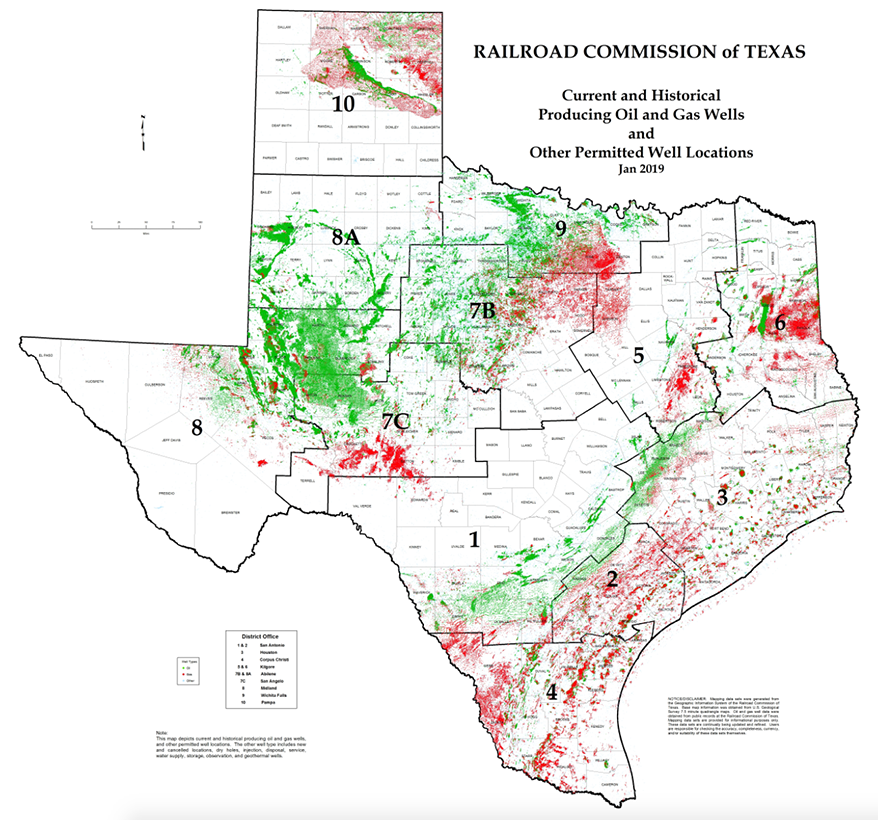
The Railroad Commission of Texas’s map of producing oil (green) and natural gas (red) wells as of January 2019 lines up fairly nicely with the counties that gave stronger support to Trump this year than four years ago. Voters may well have been putting economic self-interest over any other political consideration as they voted for president.
Down the ballot, these counties remained loyal to Democrats. Trump received over 56% of the vote in HD31, which re-elected Rep. Ryan Guillen (D-Rio Grande City), 58%-42%. Five of the eight counties we have highlighted – Brooks, Duval, Jim Hogg, Kenedy and Starr – are in Guillen’s district. His Republican challenger, Marian Knowlton, performed about as well, perhaps a little worse, in those counties than Trump in 2016. In this race, the great shift toward the Republicans was not evident. Guillen’s district has been getting redder for a number of years, but Trump’s gains here did not translate into support for Guillen’s challenger.
Back to Zapata Co. for a moment. Trump won the county by just over 200 votes. He was the only Republican to do so. U.S. Sen. John Cornyn (R) lost the county by nearly 400 votes, as did most other Republicans running statewide. This still represents a significant improvement over 2016, when Wayne Christian (R) lost the county by more than 900 votes in his RRC race. Keep in mind that Christian’s agency regulates the very industry that we are identifying as a significant driver of Trump’s performance gains.
The impact of Trump’s performance growth reduced the Democratic margin in these eight counties to just over 2K from nearly 10K.
We have not analyzed precinct-level data yet, but it appears that Republicans made gains among the Hispanic/Latino population in the metro areas as well. Trump’s performance in Tarrant Co.’s HD90 improved by 5 points. In Harris Co., Trump improved by 8 points in HD143, 7 points in HD144 and 6 points in HD145. Energy job concerns could very well have been a major factor there. Trump’s performance gains among Dallas Co. Hispanic/Latino voters appears to have been more modest: +1 point in HD103 and +2 in HD104.
At least in 2020, it appears that superior Republican outreach efforts, including digital advertising and old-fashioned door knocking, combined with uneasiness over the oil and gas economy led to a strong red-ward shift among Hispanic/Latino voters. Add to that concerns over “defunding” the police, “open borders” and labels of socialism that raise specters of brutal Latin American and Cuban regimes, and the climate is ripe for Republican gains.
The shift was not as dramatic down the ballot, but it has been shifting red-ward for years. Going back to Guillen’s district, the counties currently comprising HD31 were nearly 21 points bluer than the state in 2012. By 2018, it was just 8 points bluer than the state. Our preliminary analysis suggests it was just 1.5 points bluer than the state as a whole this year.
Whether this becomes a longer-term trend remains to be seen. Democrats have for years dreamt of higher Hispanic/Latino turnout contributing to turning the state blue. It may, in fact, help keep it red.
©2020 Texas Election Source LLC
