Members Home
Consistency in Texas: Trump Maintains Lead Over Biden in Latest Polls
|
By the Numbers: Speaker Phelan’s Narrow Runoff Win and ‘Crossover’ Voting
|
|
|
Speaker Dade Phelan was bound to make history last night. He was going to become either the first incumbent Speaker ousted in a primary or primary runoff since 1972, or he would become the first incumbent legislator to win a primary runoff after finishing in second place in the March primary since 1992.
He accomplished the latter – the first to do since Sen. John Whitmire eked out a 52%-48% victory after finishing second to Roman Martinez by 2.7 percentage points in the 1992 Democratic primary. Unofficial results show Phelan defeating challenger David Covey, 51%-49%, a margin of 366 votes. In March, Covey (46%) finished 1,015 votes ahead of Phelan (43%).
Covey ran strongest in Jasper Co., where he received nearly the same vote total in the runoff (3,214) as he did in the primary (3,302). Phelan saw his support in Jasper Co. shrink considerably. He received half the votes in the runoff (1,271) as in the primary (2,528) there. Phelan ran stronger in Jefferson Co., his home county, running up a margin of 3,145 votes in the runoff compared to 2,043 in the primary. Phelan also closed the gap in Orange Co., which Covey carried by 836 votes in the runoff compared to 2,284 in the primary.
As he did in March, Covey fared better among Election Day voters than early voters. Phelan carried the early runoff vote by 962 votes (53%-47%). Covey carried the ED vote by 596 votes (54%-46%). Early voters comprised 70% of the runoff electorate, an increase of 6 percentage points from the primary.
Covey’s campaign blamed Phelan’s relatively stronger performance on what he claimed were high numbers of Democratic crossover voters. In a statement, Covey claimed Phelan stole the election after it claimed to have “identified at least 1,442 Democrats” who cast early ballots in Jefferson Co.
Atty. Gen. Ken Paxton echoed Covey, claiming Phelan had “blatantly stolen an election from the hard-working people of his district.” Paxton used the charge to call for a “closed” Republican primary election, which would limit the number of potential voters based upon a partisan registration requirement that does not currently exist in state law.
The rhetoric of a “stolen” election now includes situations where Texas voters lawfully exercised their constitutional rights to vote in accordance with the laws of the state.
So, was the number of past Democratic primary voters casting early ballots in this Republican runoff unusually high? Let’s look at the data. To be clear, I am neither accepting the Covey campaign’s figure nor challenging it. The question is whether the figure he cited would be an outlier demonstrating evidence of a coordinated effort to draw Democratic primary voters into the runoff specifically to vote for Phelan.
In the March primary, around 4% of the early voters statewide in the Republican primary had recent history (within the past four primary elections) voting in a Democratic primary. Around 4% of the early voters in the Democratic primary statewide similarly had recent history voting in a Republican primary, according to an analysis of primary early voting by Republican strategist Derek Ryan, whose reports we have cited many times in our election analyses.
A total of 17,664 early votes have been counted in the HD21 runoff. Four percent of those is roughly 700. Covey’s campaign claims a number more than twice that figure. But the 4% measuring stick is a statewide average. What about Jefferson Co.?
According to Ryan’s data, 12.5% of early voters in Jefferson Co.’s 2024 Republican primary had recently voted at least one Democratic and one Republican primary since 2016, but their most recent primary vote was Republican. Another 6% of early voters in Jefferson Co. either had only Democratic primary voting history (4.7%) or mixed history with the most recent primary election being a Democratic one (1.4%).
That collective group of voters represented 18.6% of early voters. If the same percentage were applied to the HD21 runoff, we’d expect to see nearly 3,300 EARLY votes cast by voters who voted in at least one Democratic primary or runoff since 2016. That’s more than double the figure Covey’s campaign cited.
Is this an outlier result? No.
Let’s go back further. In the 2020 Republican primary in Jefferson Co., 9.4% of early voters had both Democratic and Republican voting history with the most recent being a Republican primary (vs. 12.5% in 2024). Another 7.1% had only recent Democratic primary voting history (vs. 4.7% in 2024), and 5.1% had mixed history with the most recent primary election being a Democratic one (vs 1.4% in 2024). Collectively, 21.6% of Republican primary early voters had some recent Democratic voting history, compared to 18.6% in 2024.
I do not have Ryan’s analysis of the 2016 primary, but I would expect to see similar numbers. Why? The 2008 Democratic primary had record turnout statewide because of the close presidential contest between Barack Obama and Hillary Clinton. It’s likely that a significant number of those voters participated in later Republican primaries as Republican candidates gained strength in the county.
This suggests that the level of crossover voting claimed by Covey’s campaign is neither an outlier nor demonstrative of an organized effort by Phelan to recruit Democratic primary voters to carry him to victory. Jefferson Co. has a demonstrated history of crossover voting, including in years in which Phelan was neither House speaker nor opposed for renomination.
Also, keep in mind that this particular claim of a “stolen” election does not hinge on allegations of illegally cast votes. This one hinges on legally cast votes from Texans that some would prefer not be able to cast them.
Winning In The Runoffs: How First-Place Primary Finishers Fare
|
|
|
|
 |
|
|
Pre-Runoff Review
Pre-Runoff Review
By Jeff Blaylock – Founder & Senior Editor
MAY. 15, 2024
Early voting for the primary runoff election begins Monday. Unlike the primary election, the runoff is always a head-to-head matchup. For the candidates, winning hinges more on turning out more of your original voters than it does on winning over others’ voters (or non-voters).
Nine incumbent legislators – eight Republicans and one Democrat – were forced into runoffs in their efforts to keep their seats. They will need to buck history to do so.
Since 1996, just 10 of 38 incumbent legislators forced into runoffs prevailed (26%), including a history-bucking three out of four in 2022. All 10 of those victorious incumbents finished in first place in their respective primary elections. Only two of the nine incumbents forced into runoffs this year finished first: Reps. Stephanie Klick and Gary VanDeaver.
The other seven, including Speaker Dade Phelan, finished in second place in their respective primaries. No incumbent legislator who finished in second place in their primary has won a runoff since 1992, when Sen. John Whitmire eked out a 52%-48% victory after finishing second to Roman Martinez by 2.7 percentage points in the primary.
Speaker Phelan risks becoming the first sitting House Speaker to be ousted in a primary or primary runoff since Speaker Rayford Price lost the 1972 Democratic runoff to Rep. Fred Head, a member of the “Dirty Thirty” who had been paired the Speaker in redistricting. Like Phelan, Price finished second in the three-way primary election. (Incidentally, then-former Speaker Gus Mutscher, who had already resigned the speakership following a bribery conspiracy conviction, lost his Democratic runoff to Latham Boone III).
These defeats arose from strong voter unrest in the aftermath of the Sharpstown Scandal, which resulted in the outright defeat of 14 House incumbents in the primary. Another 16 House incumbents were forced into runoffs. Ten were defeated. An Associated Press article from June 5, 1972, noted “As the sun rose Sunday, all the politicians even remotely connected with the Sharpstown scandals were in eclipse.”
One stunning aspect of 2024’s tumultuous Republican primary and runoff is that there is no such scandal. Instead, the carnage has been largely driven by voters’ reactions to two votes: impeaching Attorney General Paxton toward the end of the regular session and rejecting school choice (or vouchers, depending on your perspective) in a recent special session.
A second stunning aspect of the 2024 primary season is the active involvement of the governor to oust incumbents of his own party. In 1972, then-Gov. Preston Smith had to focus on his own re-election (He lost.). This year, Gov. Abbott is not on the ballot, allowing him to use his formidable war chest to influence primary elections. Abbott spent around $6M to aid Republican primary challengers before the March primary. Early next week, we should know how much more Abbott has spent to defeat incumbents.
But there is one other similarity between 1972 and 2024. In both elections, the incumbents tended to be, or be portrayed as, centrists as the faced challenges from staunch liberals (1972) or the more staunchly conservative Republicans (2024). Each election captures a decisive left- (1972) or right-ward (2024) movement of primary voters.
The Democratic primary electorate remained much more liberal even as the overall electorate grew more conservative. The last Democratic presidential nominee to win Texas was Jimmy Carter in 1976. Two years later, Bill Clements became the first Republican governor since Reconstruction. No Democrat has won statewide since 1994.
As they say in any investment fund ad, past performance does not imply future returns. One could read too much into the historical similarities, and trajectories, arising from a centrist purge in a party’s primary election. But historical patterns are patterns for a reason. In the micro-level, we will see if longtime trends hold with respect to incumbent legislators forced into runoffs. The macro-level will take longer – it always does.
Sharpstown proved a seminal moment in Texas politics. Will the ultimately unsuccessful effort to remove Paxton from office prove to be another?
Endangered Incumbents
By Jeff Blaylock – Founder & Senior Editor
MAR. 11 2024
Endangered Incumbents
Incumbents were more than endangered, it turns out. A record nine Republican incumbents fell on Tuesday. Another eight Republicans and one Democrat were forced into runoffs. Coming into this year, only a single Democrat and no Republican incumbents had lost re-election bids in a March primary in the prior two election cycles.
Reps. Steve Allison, Ernest Bailes, Travis Clardy, Jill Dutton, Jacey Jetton, Glenn Rogers, Hugh Shine, Reggie Smith and Kronda Thimesch – all Republicans – were defeated. Speaker Phelan and Republican Reps. DeWayne Burns, Frederick Frazier, Justin Holland, Stephanie Klick, John Kuempel, Lynn Stucky and Gary VanDeaver were forced into runoffs, as was Democratic Rep. Shawn Thierry.
A record 21 House incumbents – 16 Republicans, 5 Democrats – faced multiple primary challengers this cycle. Eight won outright, nine were forced into runoffs and four lost outright. Half the eight winners were Democrats, and all four of the outright losses were suffered by Republicans.
More losses should be expected. Since 1996, just 10 of 38 incumbent legislators forced into runoffs prevailed (26%), including a history-bucking three out of four in 2022. All 10 of those victorious incumbents finished in first place in their respective primary elections. Only two of the nine incumbents forced into runoffs this year finished first: Reps. Stephanie Klick and Gary VanDeaver.
The other seven, including Speaker Phelan, finished in second place. No incumbent legislator who finished in second place in their primary has won a runoff since 1992, when Sen. John Whitmire eked out a 52%-48% victory after finishing second to Roman Martinez by 2.7 percentage points in the primary.
As we have noted previously, this year felt different, at least for Republicans. In prior cycles, Republican primary challengers typically branded the incumbents as RINOs or otherwise insufficiently conservative. This year, there were two specific issues – two specific votes, actually – that seem to be driving many of the challenges. Voting to impeach AG Ken Paxton drew the ire of the conservative base. Voting to remove school choice provisions from an education bill in November drew the ire of Gov. Greg Abbott, who spent more than $6M trying to defeat them.
Seven of the Abbott-backed challengers prevailed, and five more forced runoffs. Just two – Reps. Drew Darby and Stan Lambert – successfully won renomination. Paxton, who cast a broader net with fewer resources to bear, saw seven of his challengers win and seven more force runoffs. Paxton also scored a sweep of the Court of Criminal Appeals primaries. Impeachment wasn’t the issue for the judges – it was their ruling that Paxton’s office lacked original jurisdiction to prosecute election law criminal cases.
Incumbent Legislators Defeated in Primary Elections, 1996-2024

Dueling Endorsements
In at least 18 House races, Abbott and Paxton endorsed different candidates. Abbott, backing mostly incumbents here, prevailed over Paxton in 15 races. Paxton prevailed in two, and each claimed a runoff candidate in the remaining race. In at least four races, they both backed the same challengers, and each prevailed.
Primary Turnout
|
Storylines From Primary Night |
|
By Jeff Blaylock – Founder & Senior Editor MAR. 15, 2024 Turnout Based on preliminary figures, 3.29M Texans voted in the Republican and Democratic primaries combined. This is the fourth most in state history behind 2016 (4.27M), 2008 (4.24M) and 2020 (4.11M). The 2.32M Republican primary voters is the second most in state history behind 2016 (2.84M). It is the third time in state history that at least 2M Texans voted in a Republican primary. It is also the third most voters in any party’s primary in state history, trailing only the 2008 Democratic primary (2.87M) and the 2016 Republican primary (2.84M). Republican turnout has exceeded 1M voters in nine straight primary elections. A total of 975K people voted in this year’s Democratic primary, which is the first Democratic primary since 2014 to see fewer than 1M voters. It is nonetheless a higher figure than in 2010 (681K), 2012 (590K) and 2014 (547K). This year’s turnout ranks 35th for the Democratic primary in state history. |
 |
|
Measured as the percent of registered voters casting ballots, this year’s combined primary turnout was 18.35%. This is 7 percentage points below 2020 and 11.7 percentage points below 2016. Now for the bad news. A record 14.65M registered voters did not vote in this year’s primary elections. This represents 2.55M more non-voting registered voters than in 2020 and 4.69M more than in 2016. This is the fourth straight primary election, and the 10th of the last 12 primary elections, where at least 10M registered voters sat out the primary. An estimated 2.1M Texans were eligible to vote but had not registered, raising the total number of non-voters to a record 16.73M. |
 |
|
Non-voters include non-voting registered voters and estimated non-registered eligible voters Put another way, 5 out of every 6 people who could have voted in the primary did not. That leaves the remaining 16.4% of the voting eligible population to effectively decide more than 98% of all county and state elected offices on this year’s ballot. Other Questions
Of the 21 House incumbents facing multiple primary challengers, eight won outright, nine were forced into runoffs and four lost outright. Half the eight winners were Democrats, and all four of the outright losses were suffered by Republicans. Overall, the Democrats’ record was four wins, no losses and one runoff. The Republicans’ record was four wins, four losses and eight runoffs. From 2008 to 2022, 53 House incumbents – 40 Republicans and 13 Democrats – have faced multiple primary challengers. Of those, 30 won outright and two lost outright. The other 21 were forced into runoffs, 14 of which ultimately lost. |
Storylines We’re Following for Primary Night
|
By Jeff Blaylock – Founder & Senior Editor MAR. 4, 2024 Endangered incumbents? Only one legislative incumbent has fallen in a primary election in the last two primary elections. At least four legislative incumbents were ousted in the each of the previous nine primary elections going back to 2002. This year, 57 House incumbents and two Senate incumbents face at least one primary challenger. Twenty-one House incumbents face multiple primary challengers. From 2008 to 2022, 53 House incumbents – 40 Republicans and 13 Democrats – have faced multiple primary challengers. Of those, 30 won outright and two lost outright. The other 21 were forced into runoffs, 14 of which ultimately lost. Put another way, 57% of House incumbents facing multiple primary challengers since 2008 won re-nomination outright and another 13% prevailed in a runoff. If these percentages holds for 2024, then we would expect to see 12 incumbents facing multiple primary challengers to win outright. That would put as many as nine incumbents into a runoff. It’s a question of rounding as to whether history suggests we will see an(y) outright loss(es). Dueling endorsements? Gov. Abbott and Atty. Gen. Paxton have issued dueling endorsements in at least nine contested House primaries. For the most part, Abbott backed incumbents while Paxton favored challengers (Abbott is backing other challengers, just not against Paxton’s incumbents.). History gives Abbott the edge but does not make any of his backed candidates immune to Paxton’s supporters. Bubbling underneath these endorsements are clashes more typical of past Republican primaries, including Texas Right to Life vs. Texas Alliance for Life and scorecard conservative groups against Texans for Lawsuit Reform and Associated Republicans of Texas. Open-seat Races? There’s a historical trend worth watching in significant open-seat primary races with three or more candidates. These races include open-seat races for the retiring incumbent party’s nomination or, in cases of competitive general election races, the opposing party’s nomination. Since 2006, the candidate with the highest total contributions through the 8-day-out reporting period has won outright 27% of the time and advanced to a runoff 52% of the time. The candidate with the second-highest total contributions has won outright 5% of the time and advanced to a runoff 46% of the time. No candidate outside the top two fundraisers has won such a primary outright. Only a quarter of candidates with the third-highest contribution total made a runoff. One in eight of candidates with the fourth-highest contribution totals make a runoff, and just one in 20 of everyone else. These percentages have been remarkably stable for the last 10 years. |
 |
|
Where does turnout fit in recent years? Republican turnout appears headed for the second highest in state history, measured as the total number of votes cast. As of the end of early voting, 1.23M people have voted in person or by mail in the Republican primary. It is the 9th straight primary election in which at least 1M people voted in the Republican primary and the 12th overall. If turnout reaches 2020 levels, then it will be the third time at least 2M people have voted in a Republican primary. Turnout is unlikely to eclipse the all-time mark of 2.84M set in 2016. Democratic turnout is right about where it has been most of the past five election cycles, except for 2020’s contested presidential primary. Around 600K people have voted early so far in the Democratic primary. Turnout has exceeded 1M people in each of the last four Democratic primaries – it has done so only twice in the previous 10 primaries. Some other questions will be answered Tuesday (or early Wednesday):
|
Texas House Race 30-Day-Out Report Analysis
|
Texas House Race 30-Day-Out Report Analysis Challengers Outpacing Incumbents |
|
By Jeff Blaylock – Founder & Senior Editor More than $8 million flowed into races pitting an incumbent Republican House member against one or more primary challengers during the first 25 days of the year. This is more than 1.5 times the combined totals from 2018, 2020 and 2022 over the same period. Candidates’ 30-day-out reports disclose contributions received and expenditures made between January 1 and January 25. This is the shortest campaign finance reporting period of the cycle, so it typically produces the lowest contribution totals. Not this year, at least not for races featuring an incumbent Republican House member facing at least one primary challenger. Part of the reason is the sheer number of Republican House incumbents facing primary opposition. There are 48 this year compared to 29 in 2022, 11 in 2020 and 26 in 2018. But the average contribution totals for the incumbents and their highest-funded challengers are also up over those previous years. Putting the Speaker’s primary race aside, incumbents raised an average of $104K for the period, well above the $46K average in 2022, $36K in 2020 and $67K in 2018. Their highest-funded rivals raised an average of $49K for the period this year, which eclipses the $12K average in 2022, $22K average in 2020 and $38K average in 2018. About two-thirds of all contributions for the period went to the incumbents, which represents a higher share than in 2018 (64%) and 2020 (60%) but a lower share than in 2022 (78%). Over the previous three cycles, just nine candidates – 6 incumbents and 3 challengers – exceeded $100K in contributions for the corresponding cycle. In 2024 alone, 24 incumbents and 7 challengers – received more than $100K in contributions during this short period. Seven challengers out-raised their incumbent opponents during the period, which equals the total number in 2018 (3), 2020 (2) and 2022 (2) combined. Those challengers are:
Of those, only Case ($323K to $213K) and Little ($148K to $133K) have the advantage in cash on hand entering the campaign’s final month. For the incumbents, the good news is that only one of the previous seven challengers to out-raise the incumbents for the 30-day-period won. Indeed, the batting average for House Republican primary challengers hasn’t been particularly good over the last few cycles regardless of fundraising. Only six incumbent Republican House members have fallen to primary challengers (9%) during the past three primaries (including runoffs). That said, an unusually high number of House Republicans are facing multiple primary challengers. Since 1996, 38 incumbent legislators have been forced into a runoff. All but 10 of them lost. |
Governor Greg Abbott Sets New Fundraising Records For A Non-Election Year
|
Governor Greg Abbott continues to set state fundraising records. He reported raising $19.7M in his January semiannual reports, which covered the second half of 2023. This is the most ever raised by an officeholder for a semi-annual period in a non-election year, breaking his previous record of just under $19.0M raised during the second half of 2021. |
 |
|
The green and purple bars represent Abbott’s half-year contribution totals from 2005 to 2023. The green bars indicate contributions for Jan 1-Jun 30, 2023 and the purple bars represent Jul 1-Dec 31 for each year. |
 |
|
The orange and pink bars represent Abbott’s semi-annual report cash on hand totals from 2005 to 2023. The orange bars represent the totals for Jun 30, 2023 semi-annual and the pink bars represent Dec 31 for each year. |
|
His total was bolstered by a $6M contribution from Jeff Yass, founder and managing director of Pennsylvania-based Susquehanna International Group. Yass, who is believed to be one of the country’s largest political donors, is a school choice advocate. It is the largest single contribution to a state political campaign in state history, excluding self-funded candidates and transfers between a candidate’s campaign committees. Yass’s contribution eclipses the $4M contribution to Abbott by the Republican Governors Association’s Right Direction PAC in November 2022. Abbott raised $34.9M during 2023, which is the first non-election year following his 2022 re-election. This figure is almost as much as he raised in 2019 and 2015 combined. These also were the first years after being elected governor. It is the second-most ever raised by an officeholder in a non-election year, trailing only the $37.7M Abbott raised during 2021. Even though he will not be up for re-election until 2026, Abbott was responsible for raising just over half of all funds raised by all Republican candidates and officeholders during 2023, and Abbott collected $4 out of every $9 raised by any legislative or statewide candidate or officeholder during 2023. Abbott by himself out-raised every Republican House and Senate candidate combined by $12.3M during the year. Abbott has raised just over $350M since July 1995, when the earliest campaign finance report currently available online was filed. Abbott has raised over $260M since becoming governor in January 2015 and raised over $303M since he announced he was running for governor in 2013. He has raised $144M in the last three years alone. Abbott reported having $32.4M on hand as of December 31. This is $1.2M less than his cash on hand at the same point in 2019, which was the year after his previous re-election, but is nonetheless the 15th highest cash on hand figure ever reported by a state candidate. Abbott’s campaign has reported the 24 biggest cash-on-hand totals by a state candidate in state history. He has reported having at least $20M on hand 27 times. The highest-ever cash-on-hand figure reported by a candidate not named Greg Abbott is the $27.0M figure reported by Lt. Gov. Dan Patrick as of June 30, 2022. Patrick has reported having at least $20M on hand eight times. Only one other state candidate has ever reported having at least $20M on hand: Beto O’Rourke, who had $23.9M on hand as of June 30, 2022. On several occasions, Abbott has had more cash on hand than the entire Congressional delegation. As of September 30, the state’s U.S. House incumbents (excluding Democrat Candidate Colin Allred, who is challenging US Sen. Ted Cruz) had $36.3M on hand combined, only about $4M more than Abbott. With primaries coming up, it’s likely Abbott will once again have more on hand than the delegation. We’ll find out when the congressional year-end reports are filed. They’re due January 31. |
Record Number of House Republicans Facing Multiple Primary Challengers
By Jeff Blaylock – Founder & Senior Editor
JAN. 5, 2023
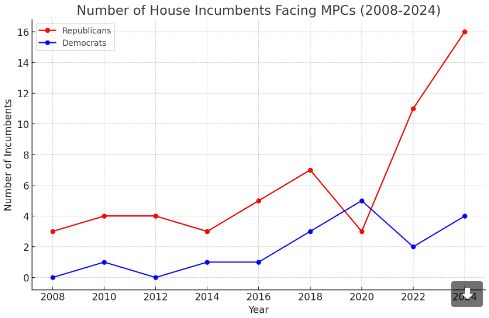
If it seems to you like more Republican House incumbents are facing multiple primary challengers (MPCs), then your perceptive powers are accurate. This cycle, 16 House Republicans are facing MPCs. This is the most in any election cycle in state history, breaking the previous record of 11 set in 2022.*
The 2022 and 2024 cycles are the only two to have double-digit incumbent House Republicans facing MPCs and only the third since at least 1996 to have at least 10 MPC races against all incumbent representatives (2018 had 10.).
The vast majority of Texas House seats are effectively decided in the primary because the current redistricting map created precious few competitive seats. The choice for voters, then, is not between parties, but instead which kind of Republican in red districts or Democrat in blue districts will represent me.
Beginning with the 2008 cycle, the bulk of intra-party conflict involving MPCs has occurred in the Republican primary. Of the 53 House incumbents facing MPCs, 40 of them were Republicans (75%). This year, 16 of the 20 are Republicans (80%). By contrast, only four House Democrats, all members of the Texas Legislative Black Caucus, face MPCs.
Since 2008, House incumbents facing MPCs have won 30 of their primary races outright (without a runoff), and another 21 were forced into runoffs. Only two – Democrats Naomi Gonzalez (2014) and Dawnna Dukes (2018) – finished third or lower in the primary. Runoffs have not generally been kind to incumbents, but they aren’t death sentences, either. Incumbents have won seven of the 21 runoffs MPCs have forced them into (33%). Overall, the incumbents have won renomination, either in the primary or runoff, in 70% of the time they had MPCs.
In prior cycles, the challengers typically branded the incumbents as RINOs or campaigned to their right, claiming the incumbents were insufficiently conservative. This year, there are two specific issues – two specific votes, actually – that seem to be driving many of the challenges. Every one of the 16 House Republicans facing MPCs voted to impeach Ken Paxton and half of them voted for retiring Rep. John Raney’s amendment removing school choice provisions from the education bill during a November special session.
The January semi-annual reports and, perhaps more so, the 30-day-out reports will provide more insight into which challengers have leveraged Paxton’s and/or Abbott’s endorsements into the cash and in-kind resources needed to oust an incumbent.
*For purposes of this analysis, we ignored the Senate, where incumbents rarely face a serious challenge, and Congress, where MPCs are a pretty common and highly unsuccessful occurrence.*