The Congressional map proposed by Sen. Joan Huffman (R-Houston) draws 35 districts with a Partisan Voting Index (PVI)* of 10 or more – not a very competitive map. Instead, it would essentially lock the partisan representation of the vast majority of voters through the coming decade, which would put all the power in the hands of primary voters.
Two districts – CD23 and CD28 – would have a PVI of +5 for the Republicans and Democrats, respectively. The lone truly competitive district would be CD15, which extends from Hidalgo Co. to the San Antonio suburbs and exurbs. It’s sufficiently competitive that U.S. Rep. Vincente Gonzalez (D-McAllen) is considering running in open CD34, which is much friendlier to Democrats.
Of course, partisan competitiveness was not the goal of the mapmakers. But what if it were? How many competitive districts could be drawn if that were the primary consideration? For this exercise, we set aside the Voting Rights Act, incumbent protection or any other consideration other than we wanted to create as many competitive districts as possible.
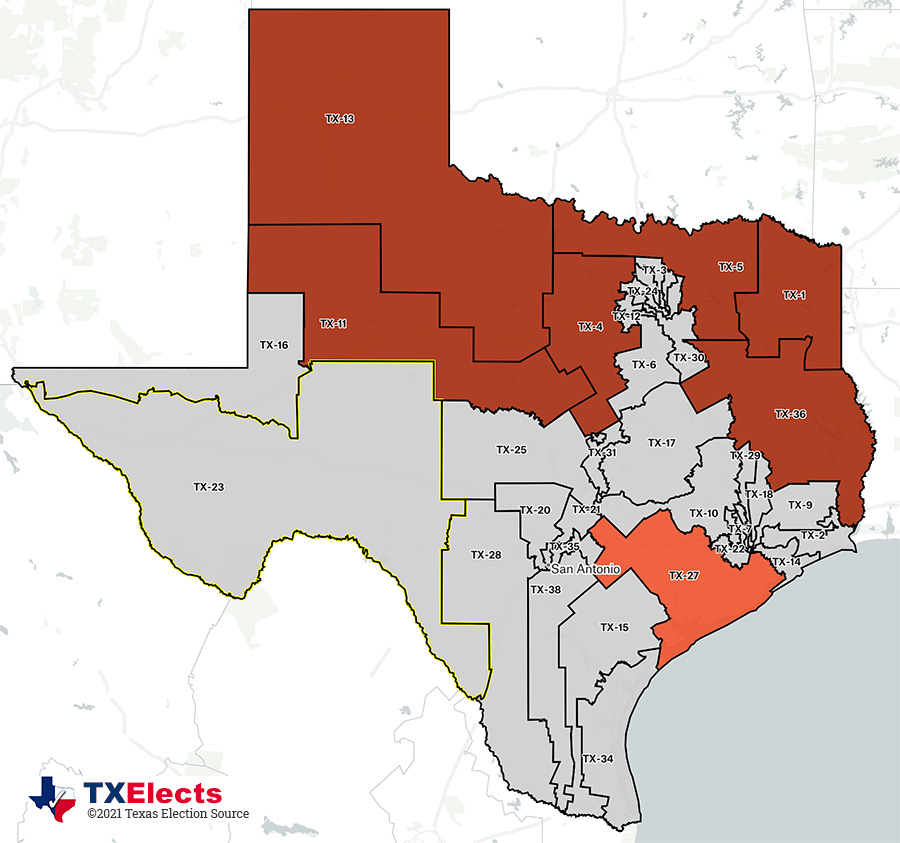
We drew 31. All but four of them have a PVI of zero. Three are D+1 and one is D+2. The remaining seven districts are all safe Republican seats with a PVI of R+19 or greater (Incidentally, the Huffman map as introduced has eight districts with a PVI of +19 or greater, split evenly between Democrats and Republicans.).
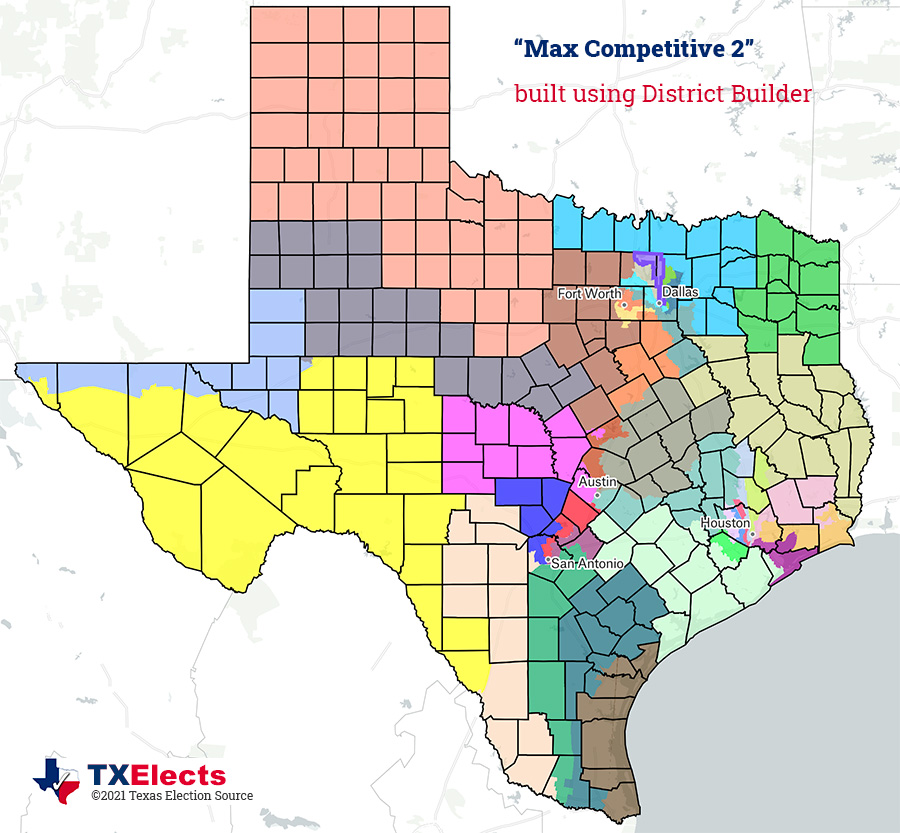
You can view our map on District Builder (Max Competitive 2**), an online tool that gives everyone the tools to draw districts and see the effects of adding or subtracting areas to a district. A close approximation of Huffman’s proposed map is also available on District Builder. Keep in mind that the Huffman proposal has already been superseded by the committee report.
Seven of our districts have a Hispanic/Latino majority, and another 22 districts are “coalition” districts where the sum of Black, Hispanic/Latino, Asian and other non-Anglo races collectively comprise a majority. Nine districts have an Anglo majority.
One of the consequences of maximizing partisan competitiveness was the inability to draw a Black-majority district. Black residents do not comprise 30% of any district. This is due to the very high correlation of the proportion of Black residents in a census block to its Democratic lean. No other group is as cohesive, except for Anglo residents in rural counties.
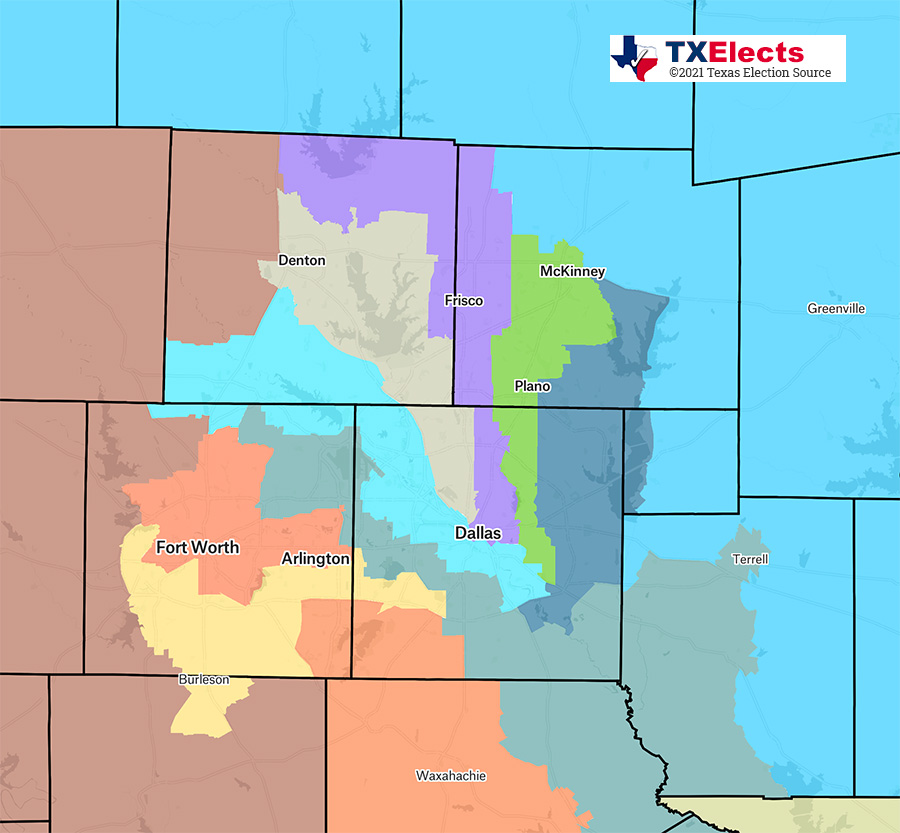
Our map achieves maximum partisan competitiveness essentially by “cracking” not only urban minority populations but also by “cracking” suburban and exurban Anglo populations. For example, Dallas Co. is divided into eight districts, all of which extend into surrounding counties. The most egregious of these is CD30, which stretches from the Tea Party stronghold of Colleyville through southern Dallas Co. and then south to Corsicana and east to Terrell. Our earlier effort to maximize competitiveness extended the district all the way to Tyler, where a pocket of Democratic votes, mostly from Black voters, sits untapped in our Max Competitiveness 2 map. All eight of these Dallas Co. districts are competitive.
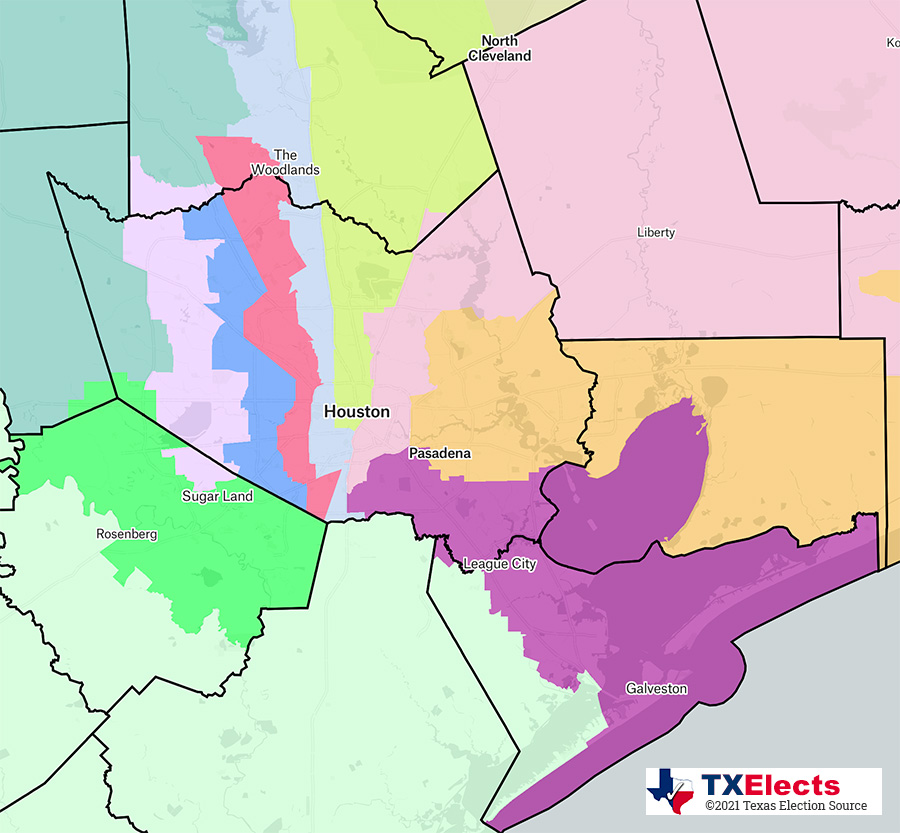
Harris Co. includes portions of 10 districts, all competitive, only one of which (CD7) is entirely within the county. The others spread into surrounding counties to offset Republican votes there. As we drew it, CD22 is 33% Anglo, 24% Hispanic/Latino, 22% Asian and 21% Black – the most evenly diverse coalition district we crafted.
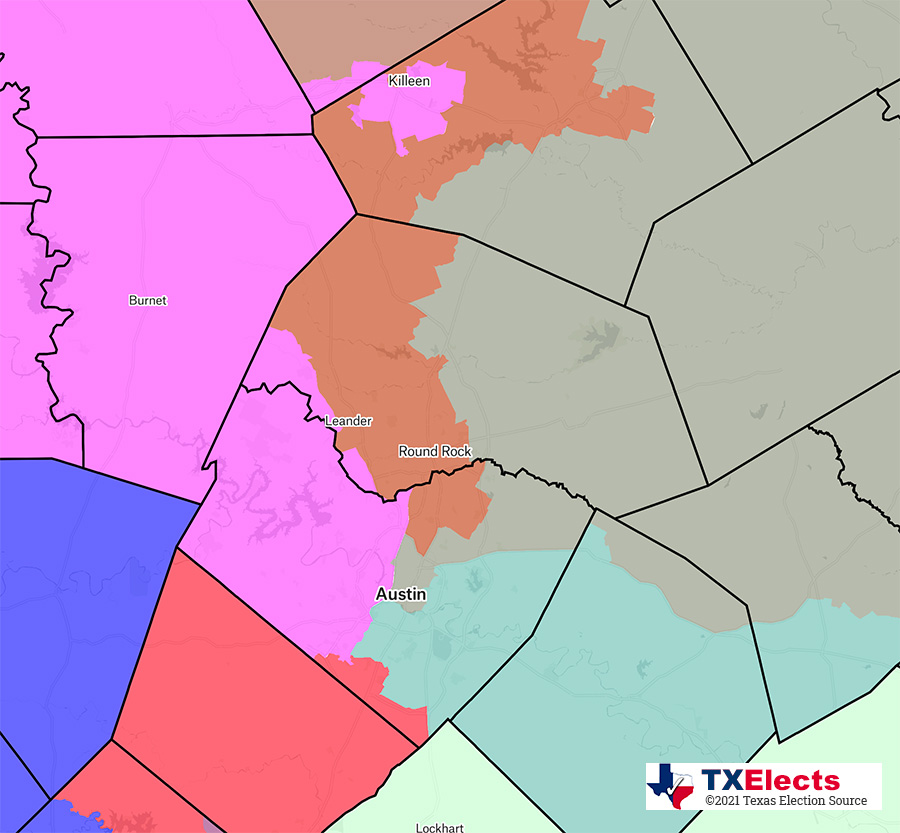
Travis Co. includes portions of five districts, all of which are competitive. Heavily Democratic Austin balances the heavily Republican Hill Country (CD25), Republican swaths of Williamson and Bell Cos. (CD17 and CD31) and the Republican territory between Travis and Harris Cos. (CD10). CD21 includes only a tiny portion of southern Travis Co. Most of its Democratic votes come from San Antonio and San Marcos.
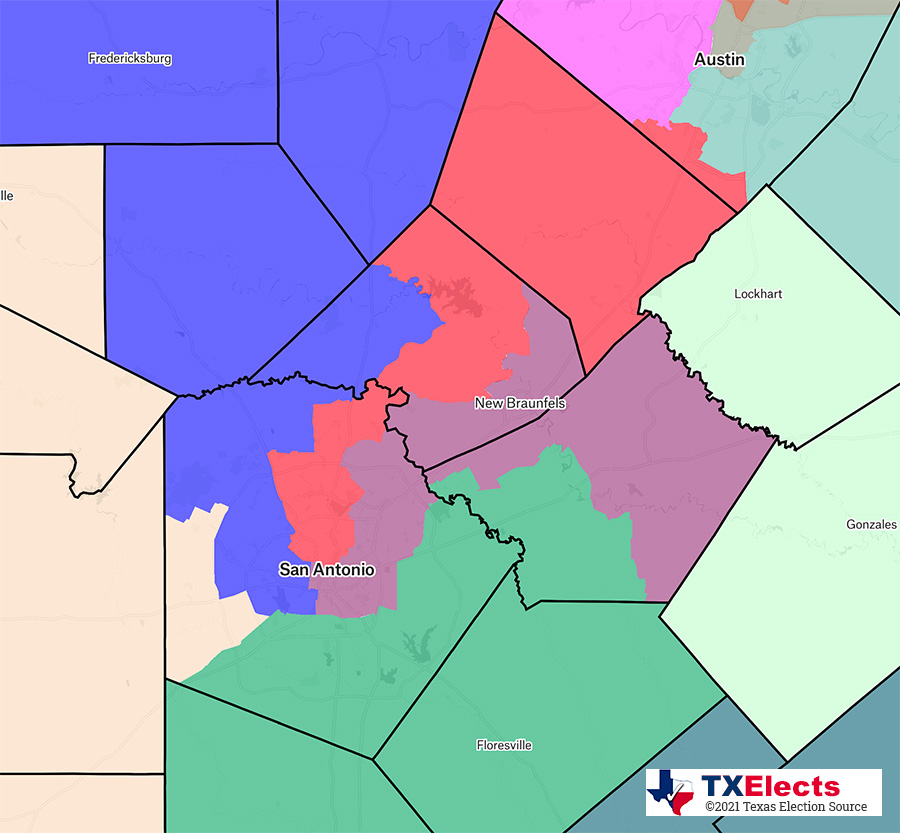
Bexar Co. is broken into five districts, two of which stretch all the way to the Rio Grande.
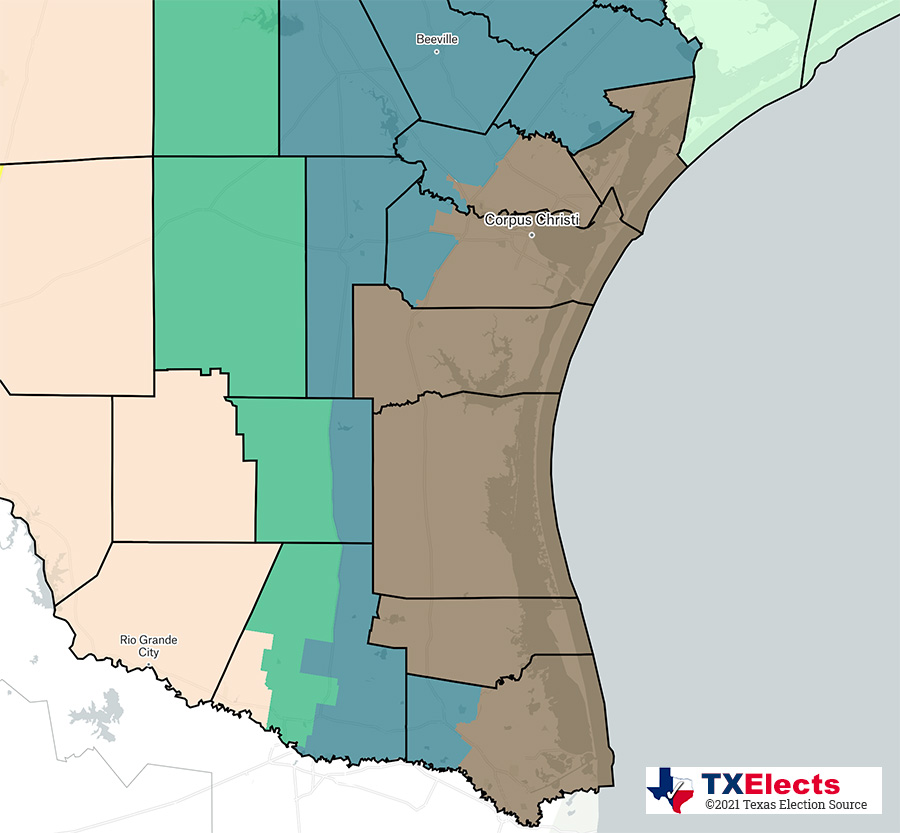
Four north-south districts emanate from Cameron and Hidalgo Cos. All four are competitive. CD15 in our map takes a very similar path northward as the proposed CD15 in the Huffman map. Our CD15 bends eastward and includes Beeville and Victoria; Huffman’s stays north and includes Floresville and Seguin. In our map, Floresville is part of CD38, which parallels CD15.
El Paso Co. is split into two, as are Culberson, Hudspeth and Pecos Cos., permitting the Democratic votes in El Paso Co. to balance out Republican votes around Midland and San Angelo.
Where partisan competitiveness could not be achieved, we grouped counties to form the remaining Safe Republican districts.
Our map splits 41 counties, 12 more than the Huffman map. Our map produces 29 majority-minority districts, seven more than the Huffman map. Neither map scores highly in compactness – 20% for our map and 19% for Huffman’s.
We did not create the map as a serious proposal. It is simply a demonstration of how partisan competitiveness could be maximized and the demographic and geographic tradeoffs necessary to achieve it.
* PVI is a measure of partisan lean calculated based on the 2016 and 2020 presidential elections. It is one of several convenient means of providing a rough evaluation of a district’s likelihood of being competitive. Texas Election Source uses a different calculation based on a broader array of offices, but it’s not convenient. For purposes of this analysis, PVI will suffice.
** This was our second effort at maximizing competitiveness. Our first effort yielded 29 districts. We thought we could do better.
©2021 Texas Election Source LLC
