Two fundamental questions will be answered Tuesday, or shortly thereafter:
- Will Joe Biden become the first Democratic presidential nominee to carry Texas since 1976 and the first Democrat running statewide to win since 1994?
- Will Democrats capture the net nine seats necessary to become the majority party in the Texas House of Representatives for the first time since the 2002 election?
The second can happen without the first, but the first cannot happen without the second. We saw this in 2008, when Democrats came within 20 votes of a 75-75 tie while Barack Obama lost the state by 950K votes.
The answer to both questions hinges on the projected 3M+ Texans who did not vote in 2016.
Donald Trump defeated Hillary Clinton, 52%-43%, in the 2016 general election. Nearly 4.5% of votes cast for certified presidential candidates went to minor party and write-in candidates. Several hundred thousand voters wrote in other names, and those votes for president were not reflected in official results. Trump’s 9-point win over Clinton was the smallest percentage-point margin for a Republican presidential candidate here since 1996. Going backwards from 2012, the previous four Republican wins had been by 16, 12, 23 and 21 points.
Since he was elected, Trump’s status has switched from political outsider to incumbent with a record to be judged by voters. His opponent today is not nearly as highly or widely disliked as his opponent four years ago. Most Texans believe the economy is worse off now than a year ago. Cases of coronavirus are on the rise across the country. The political climate for Republicans in Texas is the most challenging it has been in a generation.
Reflections of 2010
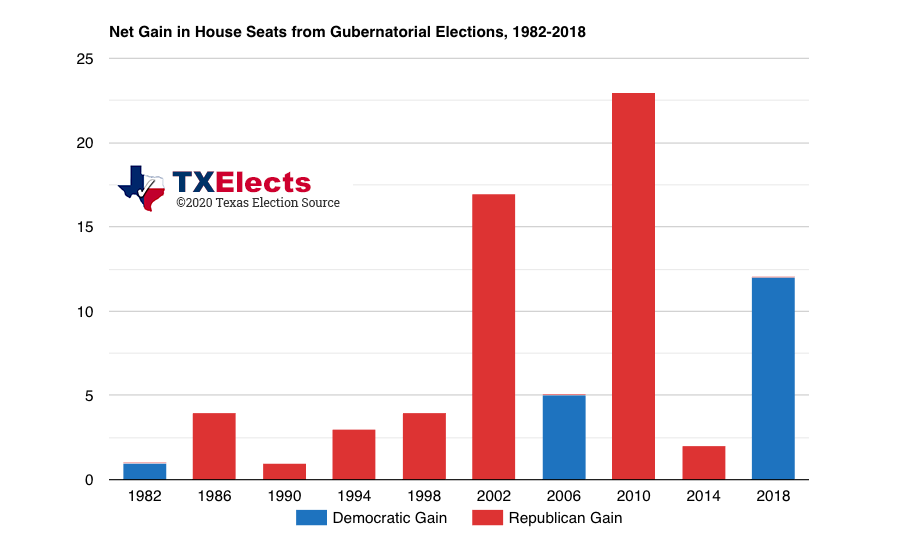
I’m a numbers guy. Texas Election Source’s models are built upon longer-term historical shifts in the electorate from the state level all the way down to the precinct. Our data goes back 20 years and demonstrates slow, steady shifts toward Republicans or Democrats. The 2018 election produced wildly larger swings – nearly all in the direction of historical shifts – that resulted in our model under-estimating Democratic performance by 2 points across the state. It also set records for gubernatorial elections. The 2006, 2010 and 2014 gubernatorial elections averaged 39% fewer voters than their preceding presidential election. The 2018 gubernatorial election saw just 7% fewer voters than the 2016 general election. It was the second-highest turnout, measured by number of voters, for an election in state history, trailing only 2016.
The easiest explanation for this record off-year turnout and observed jumps toward the Democrats is, voters have on balance reacted negatively to the first two years of Trump’s presidency, and they took this displeasure to the polls instead of sitting the election out, as many would normally do.
We observed a similar effect in 2010, when voters first judged the Obama presidency. They punished Democrats up and down the ballot, taking the state House from a 76-74 Republican majority to a 99-51 majority on Election Day. It would become 101-49 before the Legislature convened. By 2012, the number of registered voters and votes cast was essentially the same as in 2008.
This feels like the 2010 election in a mirror, except that it is playing out over two acts rather than one. And with record turnout, instead of a lot less.
Act One was 2018. U.S. Sen. Ted Cruz’s 3-point win over then-U.S. Rep. Beto O’Rourke (D-El Paso) was the smallest percentage-point win by a Republican running statewide since 1998. Between 2002 and 2016, only two Democrats running statewide crested 45%. Nine did it in 2018. In the legislature, Democrats came into that election having not picked up any seats in a gubernatorial election cycle since 2006.
Download the chart
Five of those flipped seats were in Dallas Co., leaving only two Republicans in the delegation. Democrats also picked up two Republican-held Senate seats (SD10 anchored in Tarrant Co. and SD14 anchored in Dallas Co.) and two Congressional districts (CD7 in Harris Co. and CD32 anchored in Dallas Co.).
Act Two is now. Record amounts of money are pouring into competitive races. Republicans who have long ignored their Democratic opponents, if they had any, have gone negative in many, if not all, of those races. National pundits, as have we, consider the state’s presidential race a Toss Up. Very little in the past two and a half decades would indicate that Texas would be a swing state now. It begs the question: is Donald Trump turning Texas blue (at least for this one election)?
A Souring Disposition
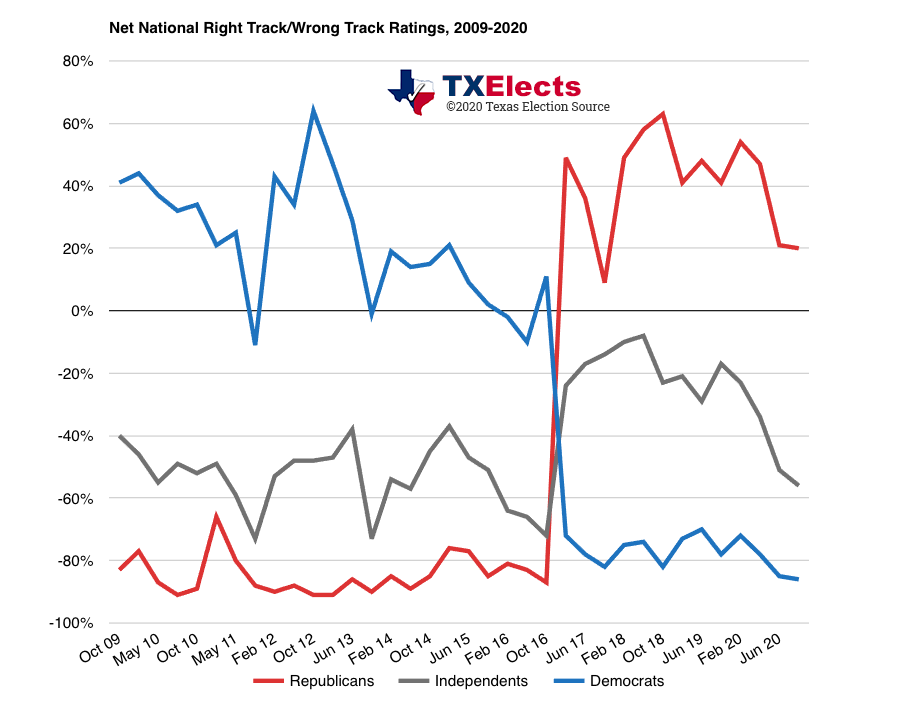
In an era of high political polarization, there is little on which every side agrees. One such item, at least in the past year, has been that the U.S. is increasingly on the wrong track.
Download the chart
The chart looks at the net Right Track/Wrong Track (RT/WT) score for self-identified Republicans, Democrats and independents as determined by the Univ. of Texas/Texas Tribune’s polls going back to their inception. Given current events, it is not surprising that each group has a less favorable view on balance than a year ago.
But it’s not just that. Look again. One of the key takeaways is the resemblance between 2020 and 2010. Voters identifying with the party in the White House have expressed far more tepid support than the other partisans’ expression of opposition. In October 2010, Democrats’ net RT/WT was +34. In the most recent poll, Republicans’ net rating was +20, an even more tepid level of support. It’s worth noting that today’s Republican RT/WT is 43 points off of Trump’s high of +63 set two years ago, while Democrats’ rating of Obama did not clear +45 until after he was re-elected.
Independent voters and the voters from the party out of power have nearly identical RT/WT going into these two elections. Independents were minus-52 in 2010 and minus-56 now. The current rating is down 39 points in a year and 48 points off of Trump’s high of minus-8. To be fair, Trump’s net RT/WT rating exceeded any of Obama’s until June. Republicans were minus-89 two years into Obama’s first term, and Democrats are minus-86 in the fourth year of Trump’s presidency.
Voters are unhappy, and unhappy voters vote. In 2010, Republicans and independents were unhappy with Obama, and they voted. Democrats, who weren’t all that happy with Obama at the time, tended to be less present at the polls.
Fast-forward to 2016. Voters were again unhappy, this time with the candidates running for president. A Marist Univ. poll conducted in the last days of October found Trump’s overall favorability rating was 38/56 and Clinton’s was 33/63. Ironically, Obama was viewed less unfavorably that either of them (43/51).
The Math of 2020
Polling paints a much tighter presidential race than in 2016. That year, Clinton never led Trump in any reputable poll, and she never received more than 45% support in any poll. Biden has led Trump in at least eight quality polls since August, and he’s been at or over 45% in 27 out of 33 quality polls released since August 1. Virtually every poll has had the race within its margin of error since the spring, including today’s (Saturday) poll from Democrat-aligned Public Policy Polling (PDF), which finds Biden leading Trump, 50%-48%.
The long-term stability of the polls suggests a couple of significant differences between now and 2016. First, most 2020 voters made up their minds long ago, and they haven’t changed wavered. In 2016, there was a much higher percentage of undecided voters, and a significant number of voters decided very late in the contest. Most of those voters broke for Trump nationally and here in Texas. Second, there aren’t many undecided voters left. The decision most voters have to make is not who to vote to for, but whether to vote.
A few things we know for sure:
- The state added 1.85M registered voters (RVs) since the November 2016 election, a figure that increases by 370K when one accounts for the voter registrations purged from the rolls in January 2017 and 2019.
- Turnout, measured as the number of people casting ballots, during the early voting period already exceeds the total number of votes cast for official presidential candidates in 2016 (9.7M to 8.9M).
- Turnout, measured as the percent of RVs casting ballots, during the early voting period is within 2 percentage points of the 2016 turnout. Early turnout is already nearly 14 percentage points above 2016, and that’s before mail ballots received after Friday are included.
- In the 30 counties with the most RVs, approximately 1 out of every 6 ballots has been cast by someone with no recent voting history in the state, according to Republican strategist and data nerd Derek Ryan’s analysis. That amounts to 1.3M votes.
- In those same counties, about 1 out of every 7 ballots has been cast by someone under 30 years old, per Ryan, amounting to around 1.1M votes. There is likely overlap between the “new” voters and the “young” voters.
All of the preceding suggests a changed electorate from four years ago. How changed is the question, and it has two parts. First, how different from the existing electorate are these “new” voters? Second, how much has the existing electorate changed its partisan lean since Trump was elected? Our model addresses both, agnostic as to whether it’s a new vote or a flipped vote.
Record-shattering Turnout, Voter Registrations
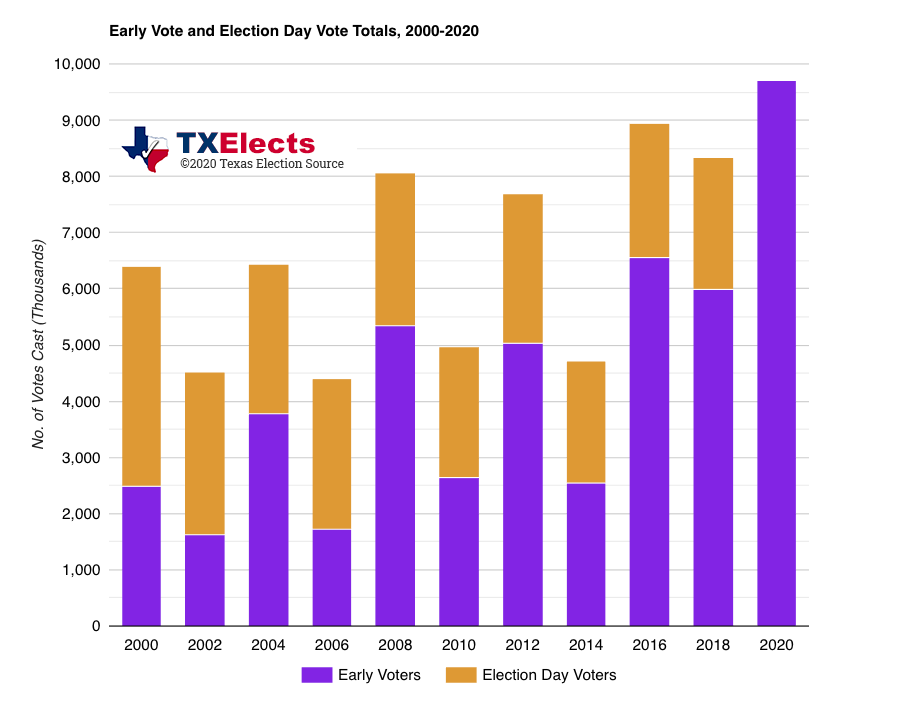
Measured as the percent of RVs casting votes for president, turnout in Texas has exceeded 70% only once in the past 50 years. The last six presidential elections have seen turnout south of 60%.
Download the chart
Already, more than 9.7M Texans – at least 57.3% of RVs – have cast ballots during the first two and first-ever third week of early voting. The number of early voters will continue to climb as more absentee ballots are returned and tabulated, so 10M early votes is not out of the question.
Around 3M people who have voted in a recent primary or general election have not yet cast ballots (as of Thursday), according to Ryan’s analysis of early voting. Including them, there are still 7.25M RVs who have not cast ballots yet. Between 2.3M and 2.8M votes have been cast on Election Day in each election, presidential and gubernatorial (except 2014), since 2004, when early voting began to represent a majority of votes cast.
We are projecting 73% of RVs will participate in this year’s election, which would represent around 2.5-2.67M Election Day voters, depending on how many more absentee ballots are yet to be received. That means a total of just under 12.4M voters, a 38% increase over 2016.
For at least a couple of decades, Democratic partisans have expressed optimism that they can win Texas if turnout is high enough. We’re about to find out.
Let’s go back to the first thing we know for sure: the state gained a net 1.85M RVs since the 2016 election. Unsurprisingly, the vast majority of those “new” RVs live in the state’s most populous and fastest growing counties.
Download the chart
Two out of every three “new” voters registered in a county with at least 250K RVs. Nearly one out of every five lives in a county with at least 100K but fewer than 250K RVs. The remaining 13% of recent registrations went to counties with fewer than 100K RVs, with a majority of those living in counties with between 20K and 50K RVs.
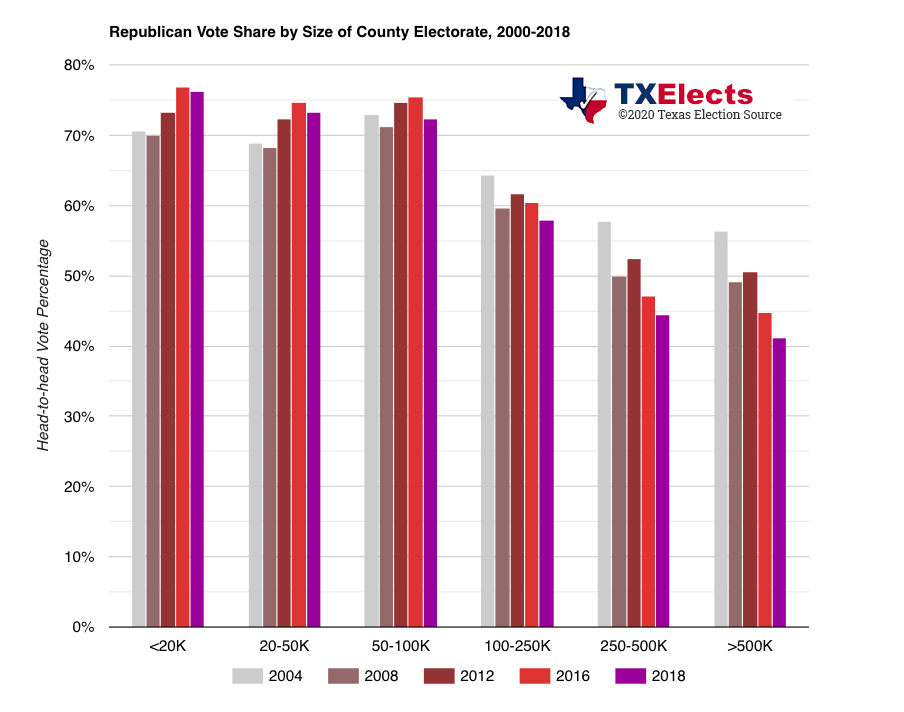
The distribution of this increase in registrations may be critical to this year’s election. Since 2004, with the slight exception of 2012, Republicans’ share of the vote head-to-head against Democrats has fallen steadily in counties that today have at least 250K RVs. Categorizing counties using today’s voter registration total, instead of by the county’s standing in each election year, enables comparisons among the same groups of counties. Republicans won a majority of the votes in these counties in 2012. Four years later, the average Republican received 47% of the vote in counties that today have 250-500K RVs and just under 45% in the largest counties. In 2018, the percentages fell again to 44.5% and 41%, respectively.
Download the chart
Republicans’ vote share is relatively unchanged in counties that today have between 50K and 250K RVs. Their vote share has increased, excepting 2018, in the counties with fewer than 50K RVs today.
Putting the two sets of numbers together, two thirds of the “new” voter registrations occurred in counties where Republicans have been steadily losing vote share, on average, to Democrats. About a quarter of the increase in RVs since 2016 belongs to counties where, on average, Republicans’ vote share has been essentially flat. The remaining 7% of “new” voters live in counties where Republicans’ vote share is steadily rising.
Statewide turnout in 2016 was 59.4% of RBs, and there was very little difference between the groups of counties we’ve outlined. Turnout was 60% in counties with more than 250K RVs, between 58.5% and 58.8% in counties between 20K and 250K, and 57% in counties with fewer than 20K RVs today.
It’s also worth nothing that voter registrations outpaced population growth for the first time in more than a decade, and the number of unregistered Texans who are eligible to vote slipped below 2M for the first time since 2008. Since 2016, the estimated voting-eligible population grew by 1.35M. As we’ve noted, there are 1.85M more registered voters now than four years ago. It’s not just population growth that’s driving record turnout. Some folks are coming off the bench and getting into the game.
Turnout Scenarios
We need to allocate 3.4M votes in order to reach the projected 73% turnout. We ran several scenarios to see how their allocation might affect the outcome, using the 2016 results as our starting point.
Scenario A – No change in proportional RV allocation or Trump vote share. In this scenario, each of the five groups of counties retains the same proportion of the total vote as it had in 2016. In other words, 59% of all votes cast in 2016 were from counties with at least 250K RVs. In 2020, those same counties would provide 59% of the total votes. Trump’s share of the vote in 2020 is equal to his 2016 share, measured head-to-head against the Democrat.
In Scenario A, Trump defeats Biden, 54.1%-44.9%, which is basically his 2016 margin except that we are projecting just 0.9% of the overall vote will go to third-party and certified write-in candidates. Essentially, this is a repeat of 2016, just with more voters.
Scenario B – Proportional allocation and no change in Trump vote share. We change the proportional vote between the groups of counties based on their share of the increased voter registrations, which results in the largest counties contributing 61.4% of the vote instead of 59%. Unsurprisingly, this small shift in votes combined with no change in Trump’s performance does not make much difference. In Scenario B, Trump defeats Biden, 53.3%-45.7%.
Scenario C – Proportional allocation and Cruz’s vote share. As with Scenario B, here we allocate the increase in county groups’ votes based on their share of the increase in voter registrations. This time, we adjust Trump’s 2016 performance based on Cruz’s performance in those counties in 2018:
- +3.42% in counties with at least 250K RVs
- +2.68% in 100-250K counties
- +3.13% in 50-100K counties
- +1.23% in 20-50K counties, and
- +0.22% in <20K counties.
These adjustments have a more significant impact on the vote estimates. Trump would still win, 50.4%-48.6%, a margin of just over 225K votes. In this scenario, Biden wins the largest counties by 1.41M votes but loses the rest of the state by 1.64M votes. Trump’s 2016 vote margin in the counties with fewer than 250K RVs was 1.31M, so this is not an unreasonable estimate.
Scenario D – Proportional allocation and half again Cruz’s vote share. This takes Scenario C and continues Cruz’s 2018 performance versus Trump’s into 2020, but just by half. In other words, in the bigger counties, the shift between 2016 and 2018 was 3.42% toward the Democrats. We add an additional 1.71%. This scenario produces a Biden win, 50.1%-49.0%, a margin of 133K votes out of 12.4M cast. Biden’s projected margin in the largest counties would be 1.67M votes under this scenario, and Trump’s margin in the rest of the state would be 1.54M.
Scenario E – Proportional allocation with adjustments to bringing Cruz’s vote share forward. This is very similar to Scenario D except we reverse the 2018 shift in counties with 20-50K RVs and accelerate Republican gain in counties with fewer than 20K voters. We also decrease the rate of the Democrats’ gain to 1% in counties with 100-250K RVs and freeze the 2018 rate for counties with 50-100K RVs. Biden’s margin in the big counties remains 1.67M, but Trump’s margin in all the other counties rises to 1.85M. In this scenario, Trump wins, 50.3%-48.8%.
For what it’s worth, this scenario is almost exactly Fivethirtyeight’s forecast vote share this evening (Saturday).
Scenario F – In this scenario, we leave the counties under 250K the same as in Scenario E, but we apply the full change in Cruz’s vote share to 2020. Measured head-to-head, Cruz in 2018 received 3.42% of the vote less than Trump in 2016. We double that number for 2020 to make Trump’s 2020 vote share 6.84 percentage points below his 2016 share in the largest counties. In this scenario, Biden wins, 50.0%-49.2%. Trump’s margin in counties with less than 250K RVs remains 1.85M but Biden’s margin in the big counties rises to 1.93M.
Projection
The most plausible of these, based on our modeling philosophy, is Scenario E. Changes in voter turnout from 2016 will be more correlated to changes in voter registration than anything else. The larger counties on balance continue to get friendlier to Democrats, particularly suburban areas with higher proportions of college-educated and younger voters. The smaller counties will be a bit redder in 2020 than they were in 2016. Our district-level model projects a continued red-ward shift of the areas outside the larger metro areas, so it would make sense to view O’Rourke’s small gains in those counties, relative to Clinton, as ephemeral.
It thus becomes a question of which pool of net votes is bigger: Biden’s advantage in the most populous counties our Trump’s advantage everywhere else. Sometime after 7 p.m. on Election night, it will appear to be the former. Biden and many other Democrats should be well ahead based on the big county’s quick reporting of their early and absentee vote. Republicans will start clawing that back as the smaller counties report their early totals and Election Day votes are counted.
I am inclined to believe Trump’s margins in the rest of the state will be bigger, but barely. The ingredients are in place for urban and suburban voters to overtake the latter, and it would not surprise me if Biden eked out a victory here. It’s incredible to be writing those words based on the past 26 years of election results, but here we are.
Left with a Toss Up race and a huge, impossible to model flood of new voters, the choice is to be bold and become the only prognosticator saying Biden, or to stay with the herd and call it for Trump. Some of the best professional advice I ever got was this: it’s okay to win alone, just don’t lose alone.
Trump 49.9%, Biden 49.2%.
—
At the beginning of this analysis, I posed two questions. The first was about the presidential race, which has been answered. The second was whether Democrats could retake the state House. We’ll explore that a bit tomorrow, but the short answer is, yes.
Texas Presidential Polls
- Biden 50, Trump 48 – Public Policy Polling (October) – LV
- Trump 48, Biden 47 – UMass-Lowell (October) – LV
- Trump 50, Biden 46 – RMG Research (October) – LV
- Trump 47, Biden 43 – NYT/Siena Coll. (October) – LV
- Biden 49, Trump 48 – Data for Progress (October) – LV
- Trump 50, Biden 45 – Univ. of Houston (October) – LV
- Biden 48, Trump 45 – DMN/UT-Tyler (October) – LV
- Trump 47, Biden 47 – Quinnipiac Univ. (October) – LV
- Trump 46, Biden 44 – Data for Progress (October) – LV
- Trump 49, Biden 47 – Morning Consult (October) – LV
- Trump 50, Biden 45 – Univ. of Texas/Texas Tribune (October) – LV
- Trump 48, Biden 48 – Public Policy Polling (October) – V
- Trump 51, Biden 44 – Crosswind (October) – LV
- Trump 49, Biden 49 – EMC Research (October) – LV
- Biden 47, Trump 45 – Data for Progress (October) – LV
- Trump 48, Biden 48 – Civiqs (October) – LV
- Trump 49, Biden 46 – UMass-Lowell (September) – LV
- Trump 48, Biden 48 – Public Policy Polling (September) – LV
- Trump 46, Biden 45 – Data for Progress (September) – LV
- Trump 50, Biden 45 – Quinnipiac Univ. (September) – LV
- Trump 46, Biden 43 – NYT/Siena Coll. (September) – LV
- Trump 48, Biden 46 – CBS News/YouGov (September) – LV
- Trump 46, Biden 46 – Morning Consult (September) – LV
- Trump 48, Biden 47 – Public Policy Polling (September) – V
- Trump 48, Biden 46 – DMN/UT-Tyler (September) – LV
- Biden 48, Trump 45 – Data for Progress (September) – LV
- Trump 48, Biden 47 – Morning Consult (August) – LV
- Biden 48, Trump 44 – Tyson Group (August) – LV
- Biden 48, Trump 47 – Public Policy Polling (August) – V
- Biden 47, Trump 45 – Global Strategy Group (August) – LV
- Trump 48, Biden 41 – YouGov/THPF (August) – RV
- Trump 49, Biden 43 – Trafalgar Group (August) – LV
- Trump 47, Biden 46 – Morning Consult (August) – LV
- Biden 47, Trump 45 – Morning Consult (July) – LV
- Trump 49, Biden 45 – SPRY Strategies (July) – LV
- Biden 45, Trump 44 – Quinnipiac Univ. (July) – RV
- Trump 46, Biden 45 – CBS News/YouGov (July) – RV
- Trump 46, Biden 44 – Gravis/OANN (July) – LV
- Biden 48, Trump 43 – DMN/UT-Tyler (July) – LV
- Trump 48, Biden 44 – UT/Texas Politics Project (July) – RV
- Biden 45, Trump 44 – Fox News (June) – RV
- Trump 48, Biden 46 – Public Policy Polling (June) – V
- Trump 48, Biden 48 – Public Policy Polling (June) – V
- Trump 44, Biden 43 – Quinnipiac Univ. (June) – RV
- Trump 47, Biden 41 – Emerson (May) – RV
- Trump 50, Biden 43 – Morning Consult (May) – LV
- Trump 43, Biden 43 – DMN/UT-Tyler (May) – RV
- Biden 47, Trump 46 – Public Policy Polling (April) – V
- Trump 49, Biden 44 – UT/Texas Tribune (April) – RV
- Trump 45, Biden 44 – DMN/UT-Tyler (March) – RV
- Trump 49, Biden 45 – Marist Coll. (February) – RV
- Trump 46, Biden 43 – Univision/Univ. of Houston (February) – RV
- Biden 48, Trump 47 – CNN/SSRS (February) – RV
- Trump 47, Biden 43 – UT/Texas Tribune (February) – RV
- Trump 44, Biden 42 – DMN/UT-Tyler (February) – RV
- Trump 51, Biden 46 – Texas Lyceum (January) – LV
- Trump 48, Biden 47 – CNN/SSRS (December 2019) – RV
- Trump 45, Biden 39 – DMN/UT-Tyler (November 2019) – RV
- Trump 46, Biden 39 – UT/Texas Tribune (November 2019) – RV
Links go to our coverage or commentary on the polls. If there is no link, then we either did not see the poll or otherwise did not have enough information to report on it. Legend: LV-Likely Voters, RV-Registered Voters, V-Voters
©2020 Texas Election Source LLC
